Bellchain Start for free

Signal study

20 popular crypto signals, backtested over a year

Every rule on BTC and ETH with 4-hour candles, every signal as a trade with TP +5% and SL −2.5%, after fees. Computed with the same engine that fires your alerts at Bellchain.

4 of 20 rules end up in profit after fees.

Period 2 November 2025 to 2 November 2026

rules
20
signals
1,780
in profit
4/20
days
365

What the numbers show

On their own, most signals lose

16 of 20 rules would have lost money after fees. A single indicator fires even when the trend is against it. Link indicators wisely and those signals get filtered out, and that is exactly what Bellchain helps you do.

On its own

  1. RSI below 30
  2. Alert

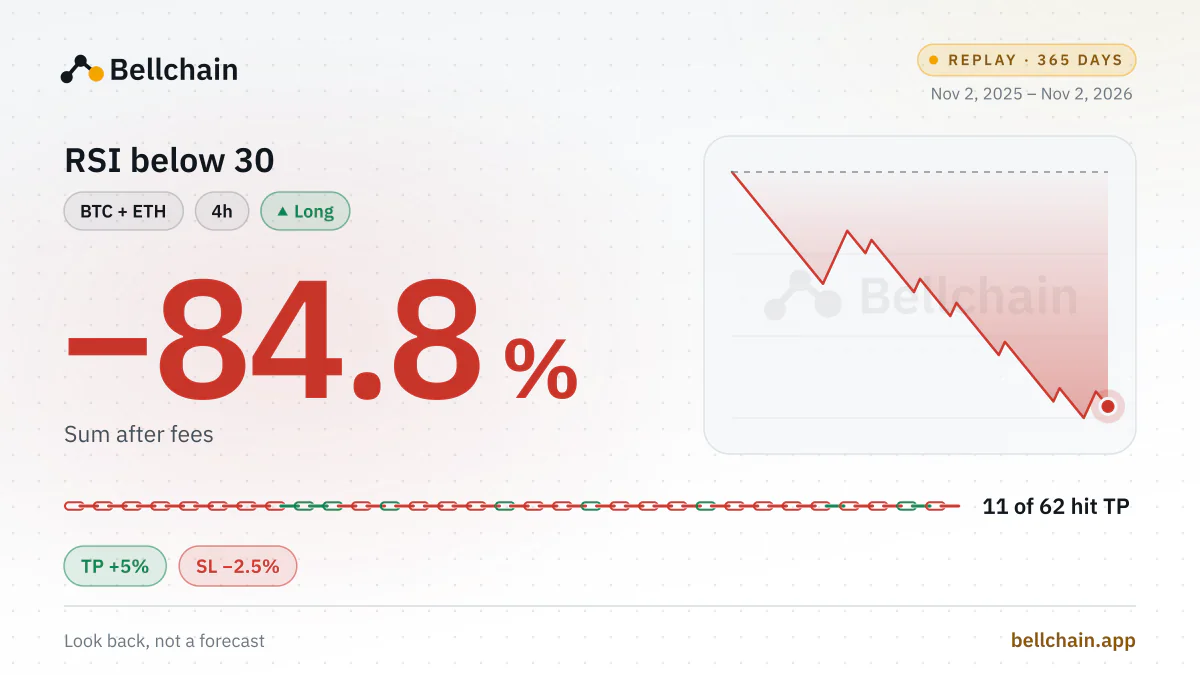
−84.8% 62 signals, 11 hit TP

Linked

  1. RSI below 30
  2. above EMA 200
  3. AND
  4. Alert

Only fires in an uptrend

Link your own

Ranking

Sum after fees per rule

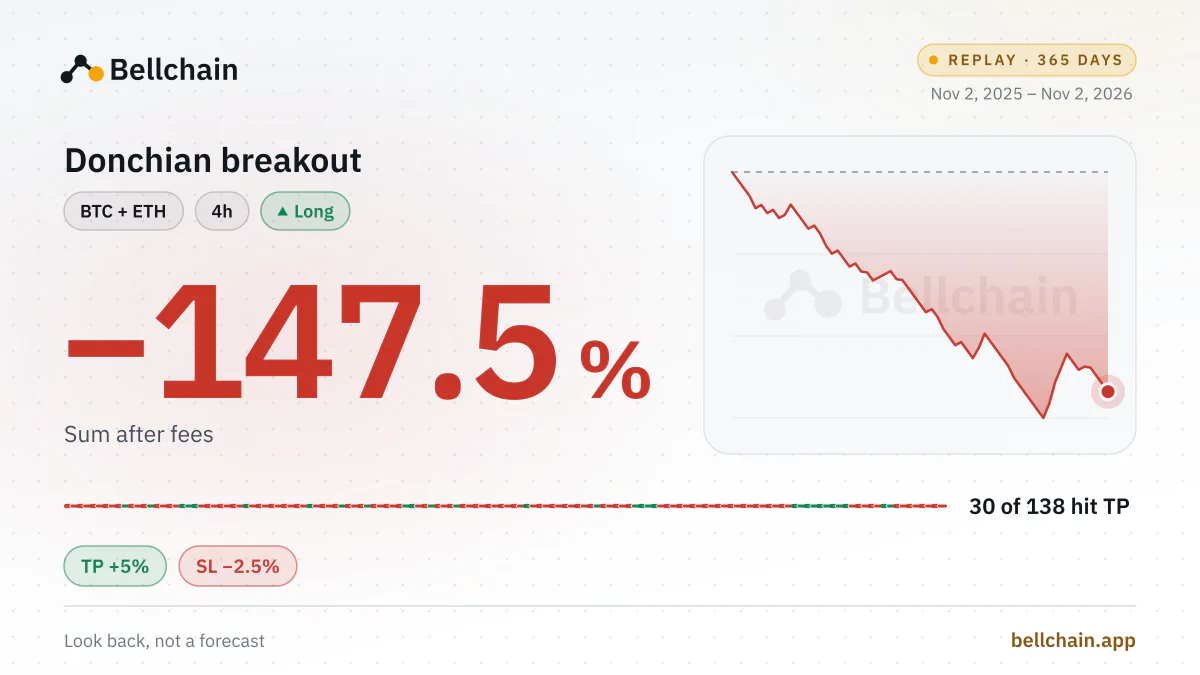
Every signal with the same stake, the results of both coins added up. With €100 per signal, −147.5% means a loss of €147.50.

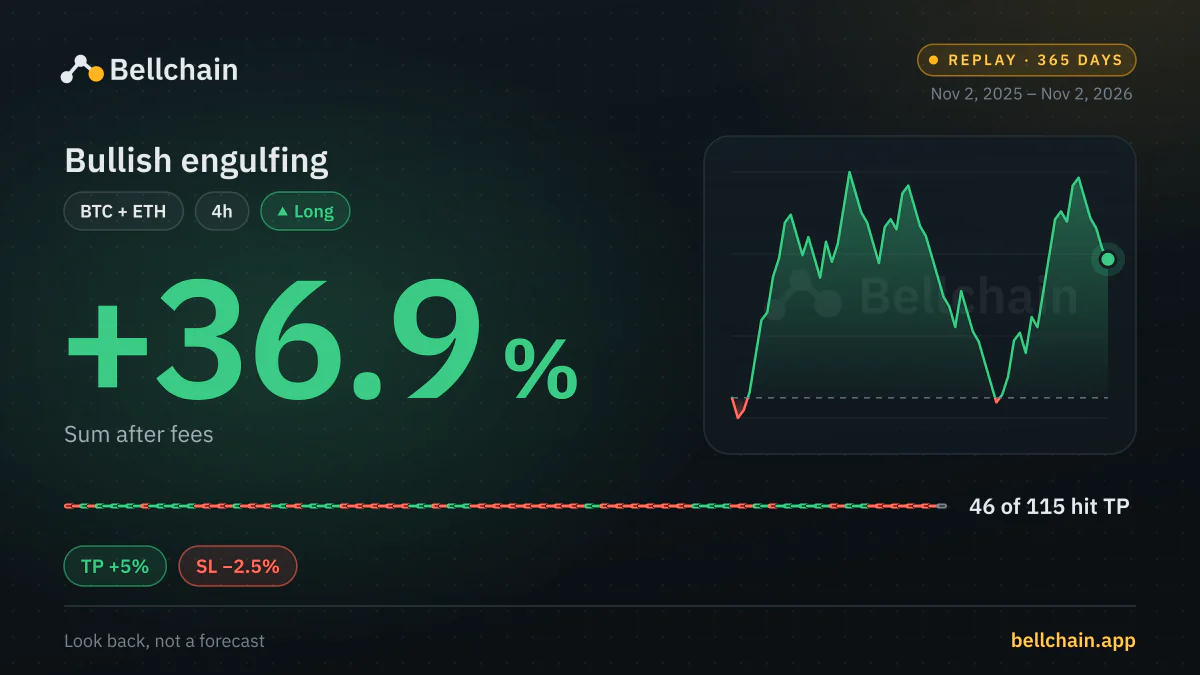
  1. 1 Bullish engulfing +36.9%
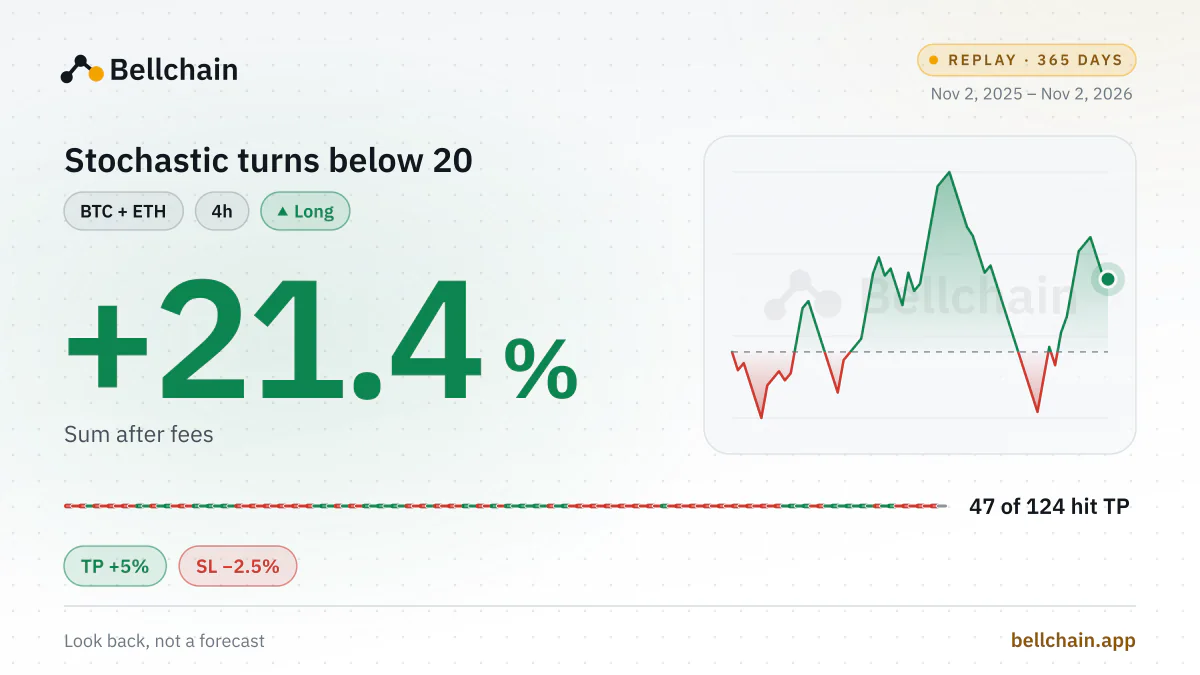
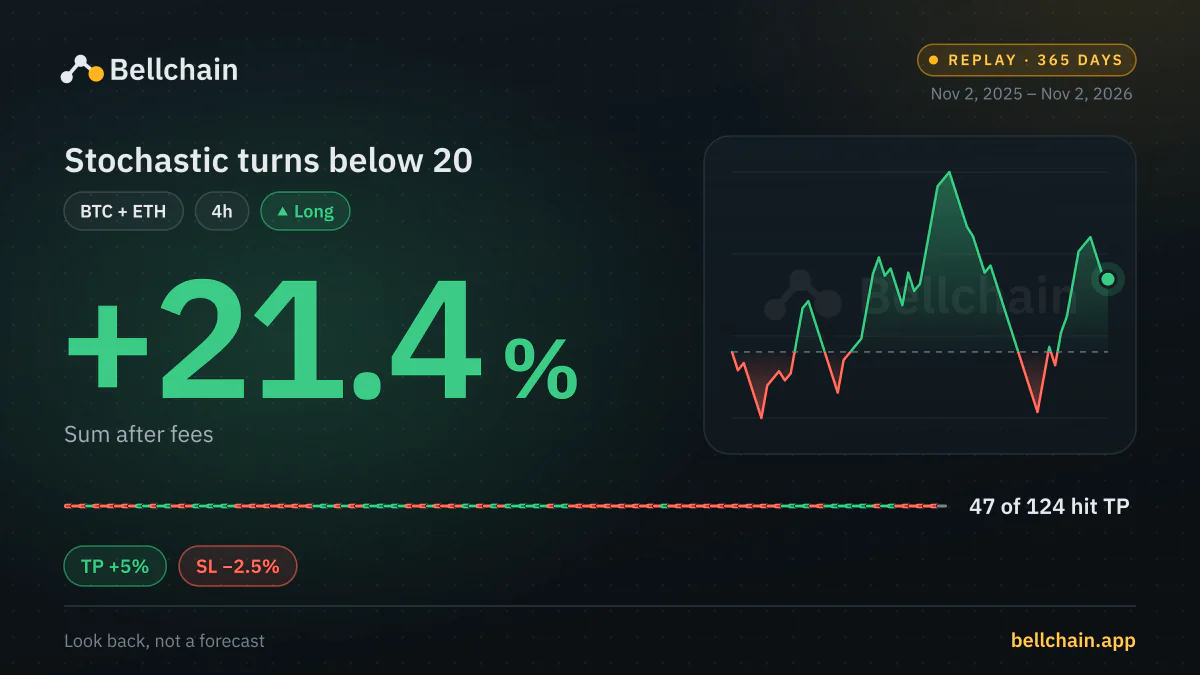
  2. 2 Stochastic turns below 20 +21.4%
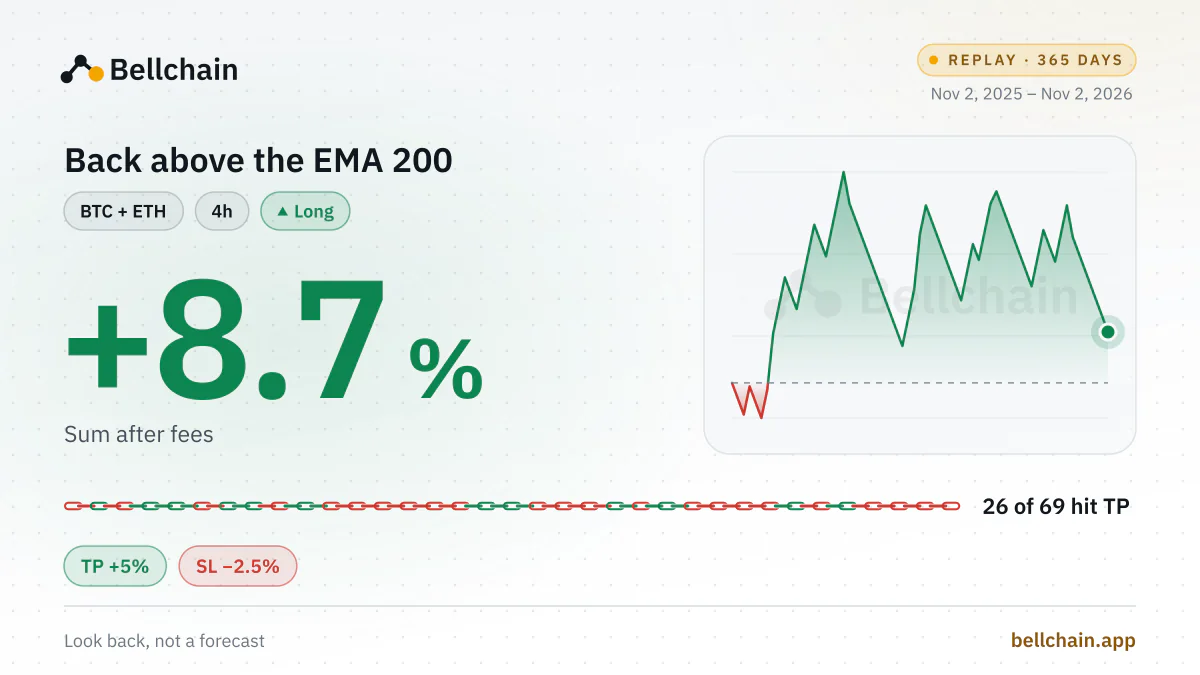
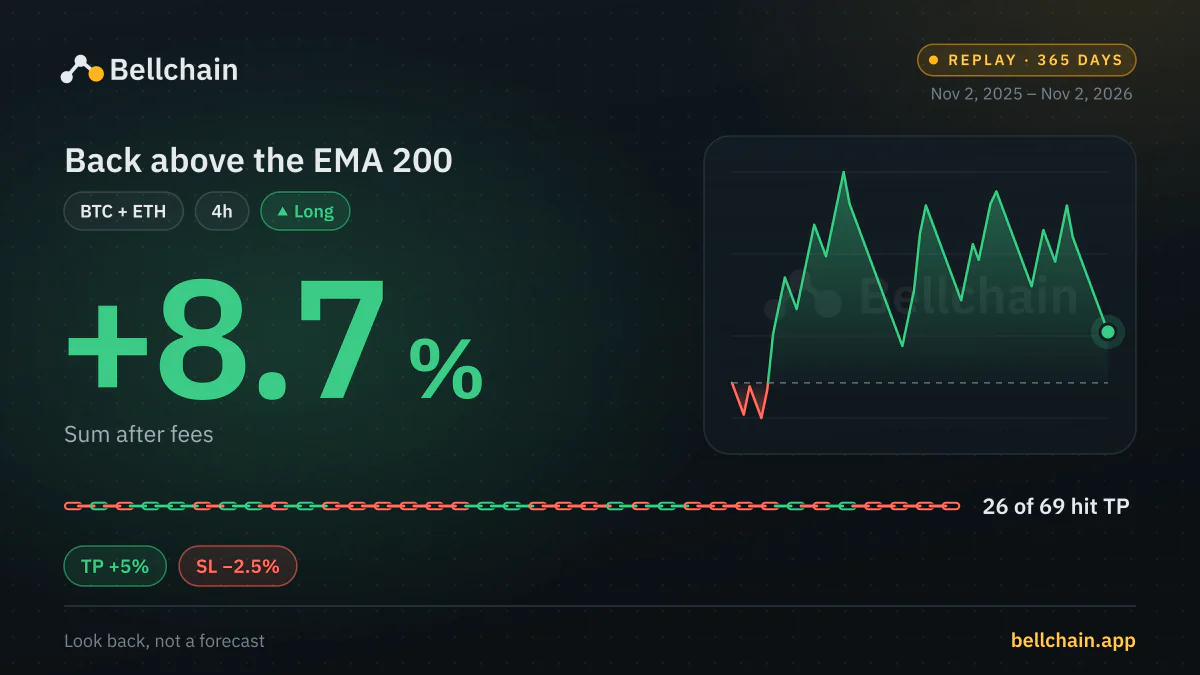
  3. 3 Back above the EMA 200 +8.7%
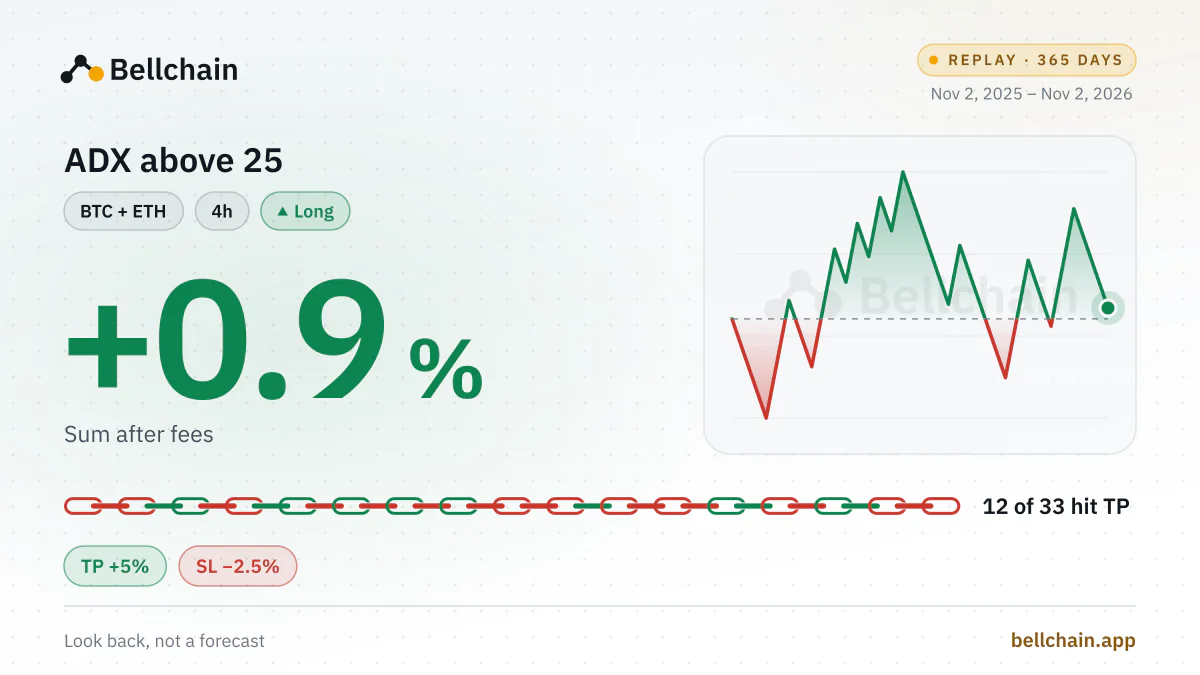
  4. 4 ADX above 25 +0.9%
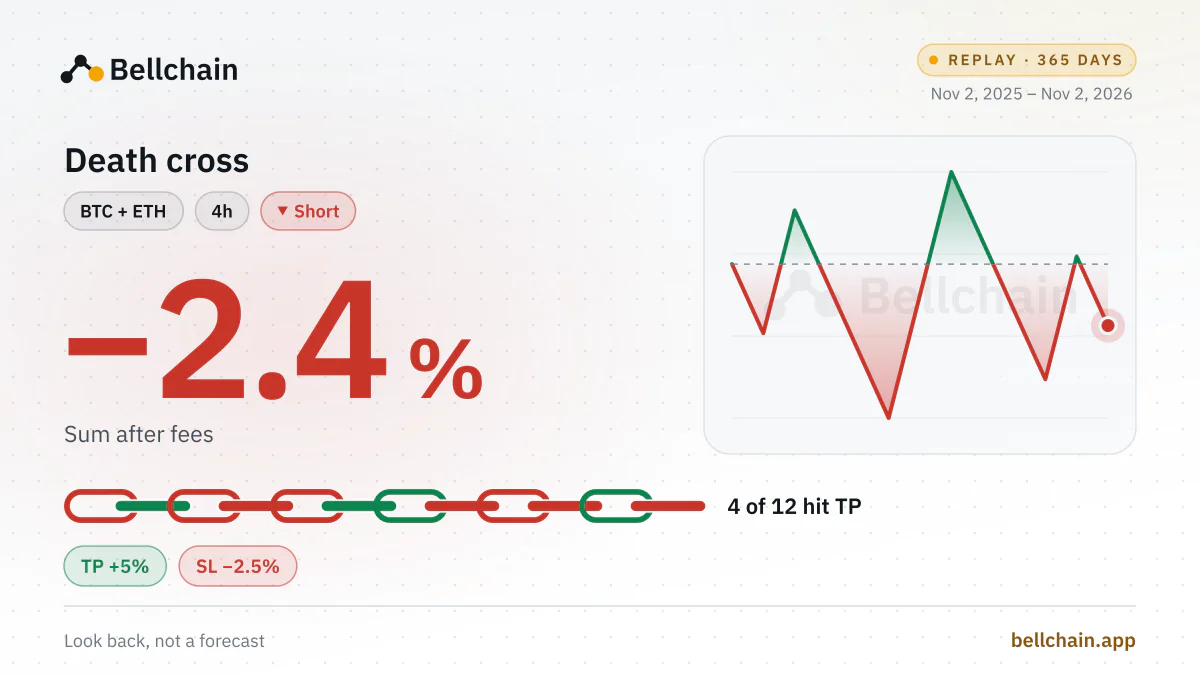
  5. 5 Death cross −2.4%
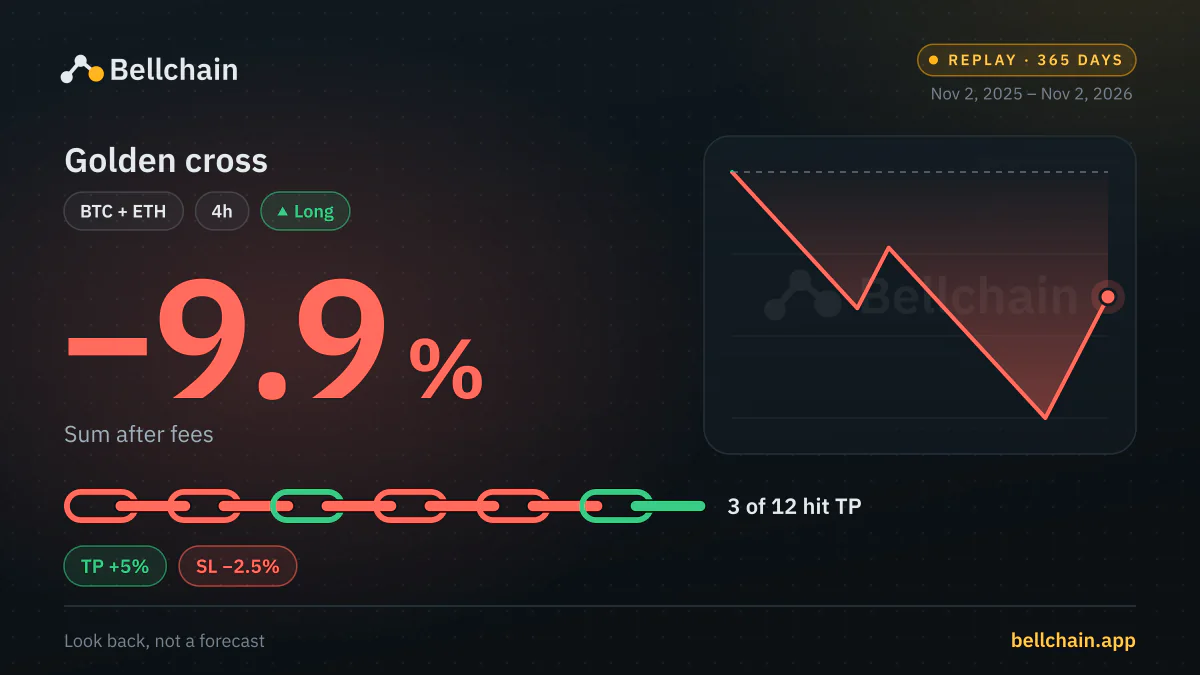
  6. 6 Golden cross −9.9%
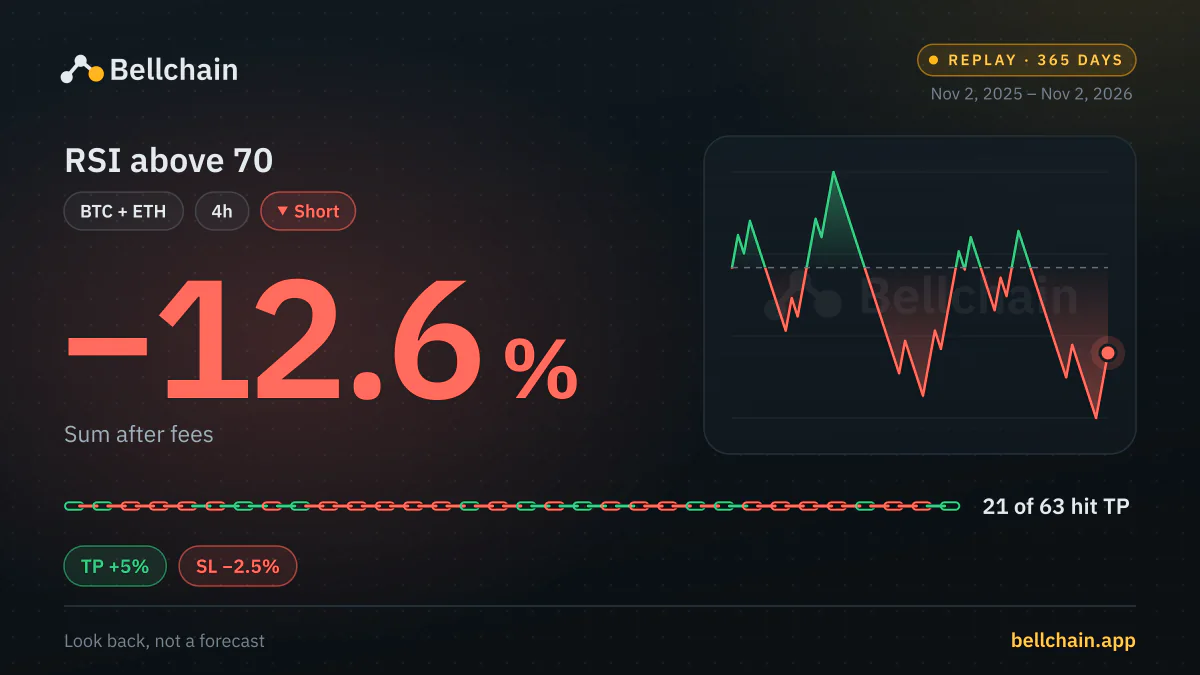
  7. 7 RSI above 70 −12.6%
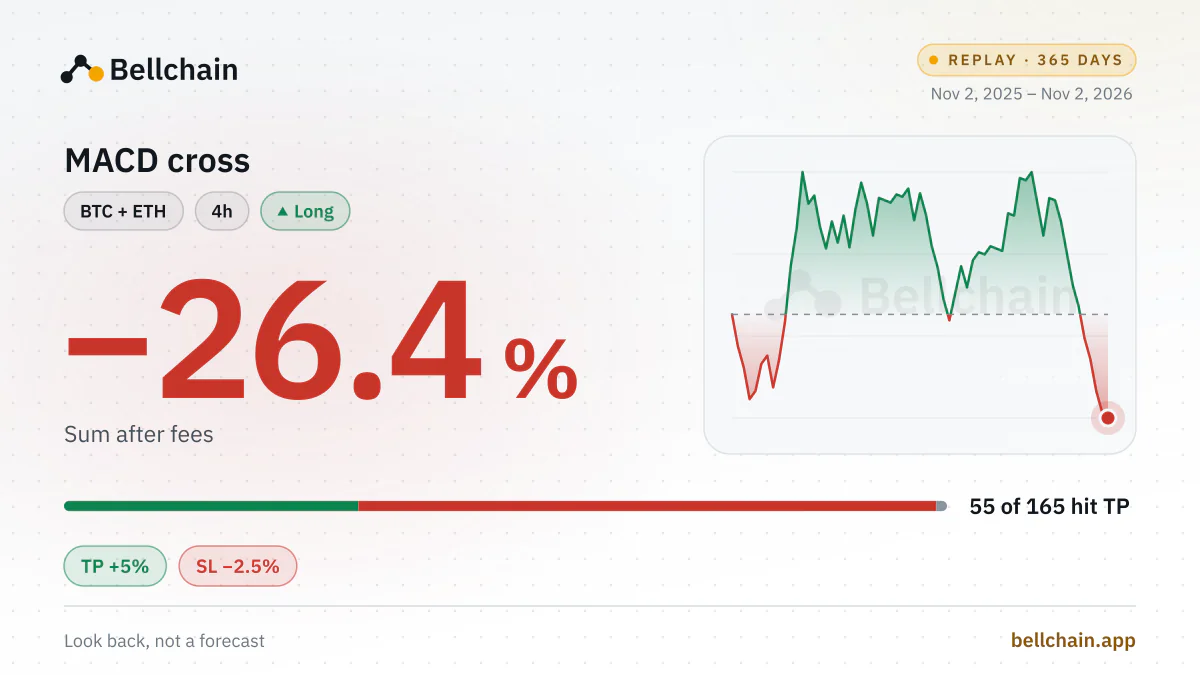
  8. 8 MACD cross −26.4%
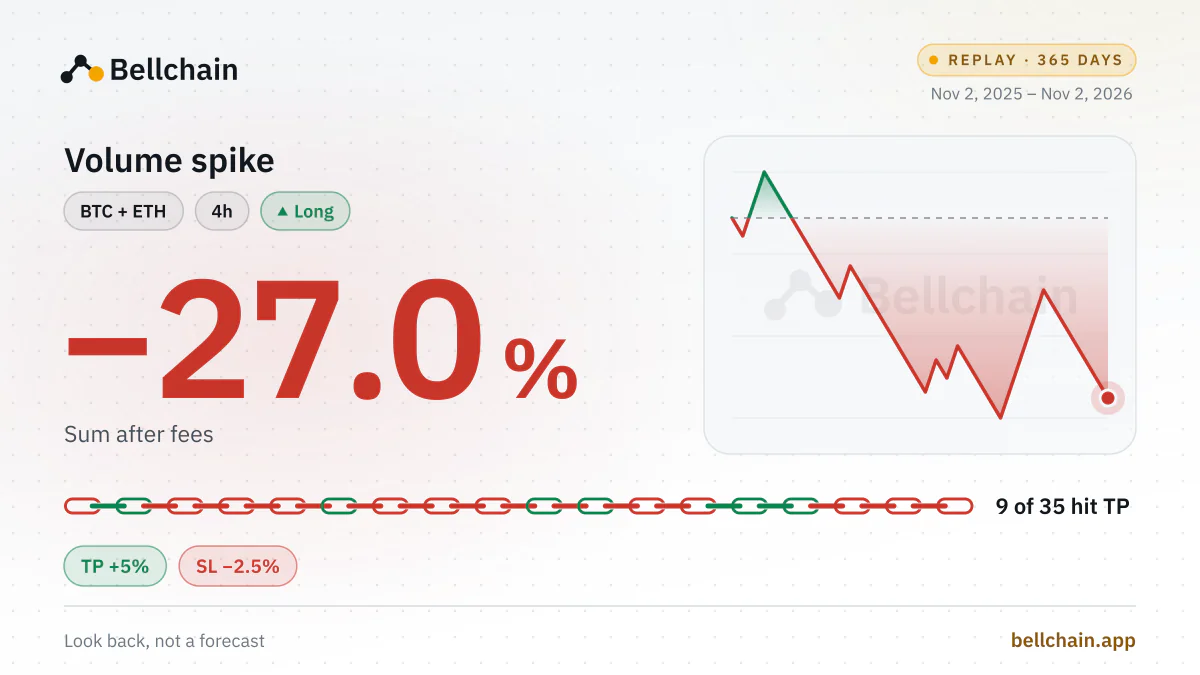
  9. 9 Volume spike −27.0%
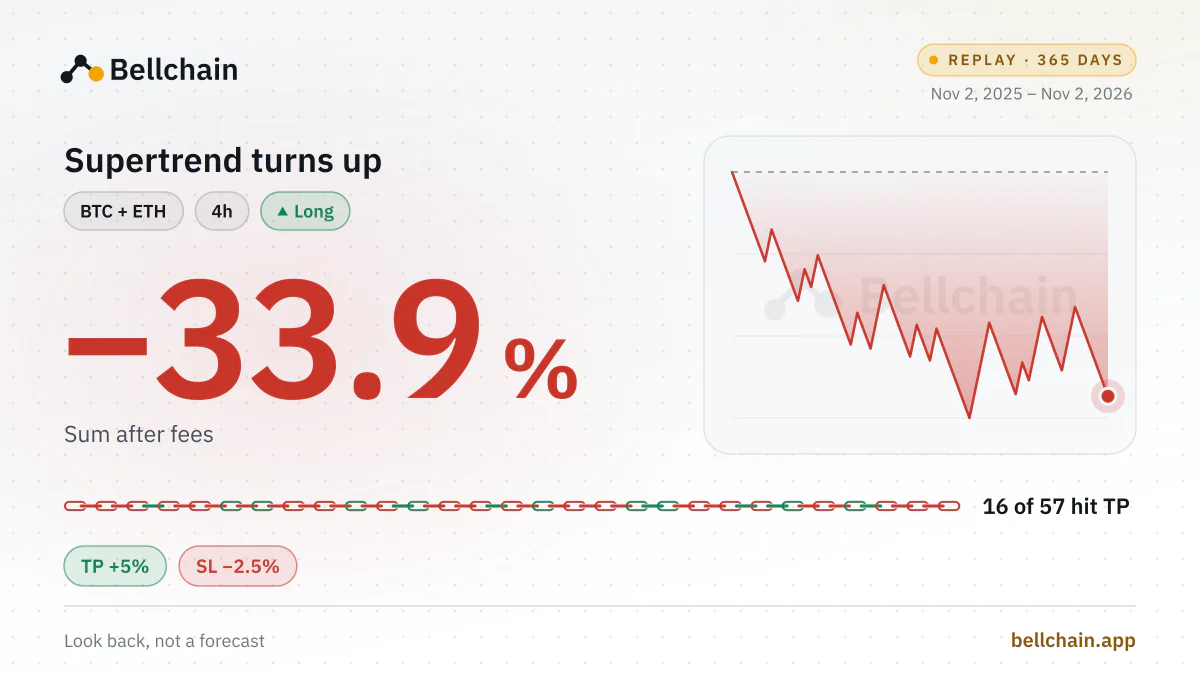
  10. 10 Supertrend turns up −33.9%
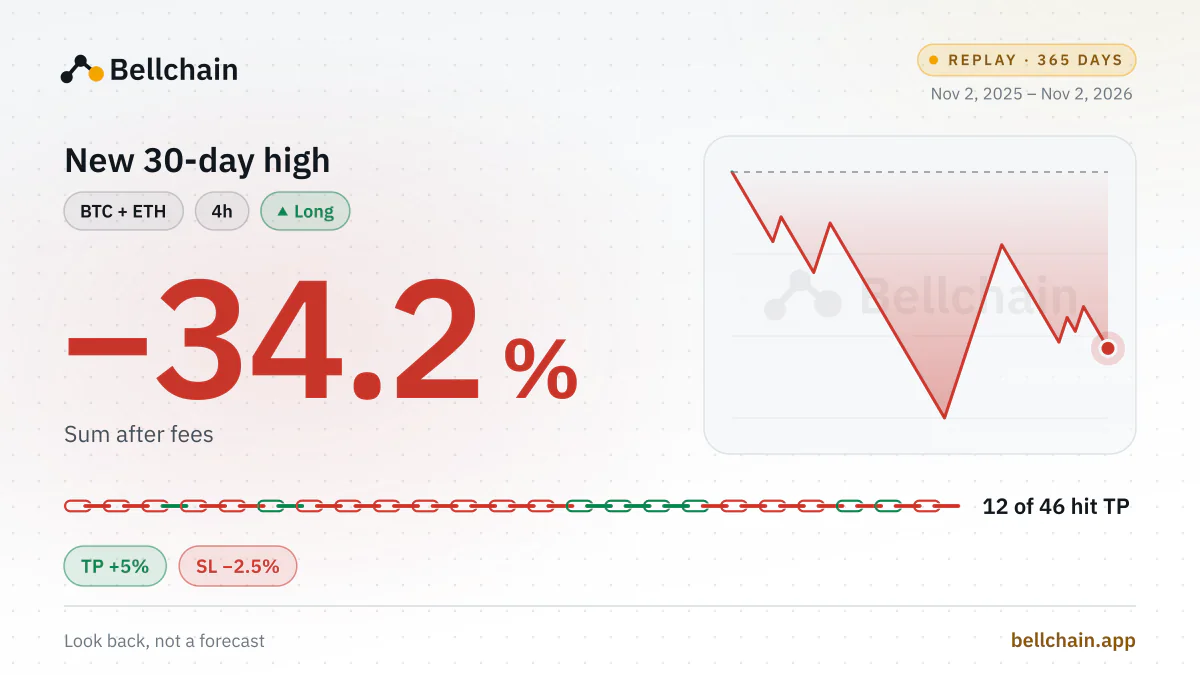
  11. 11 New 30-day high −34.2%
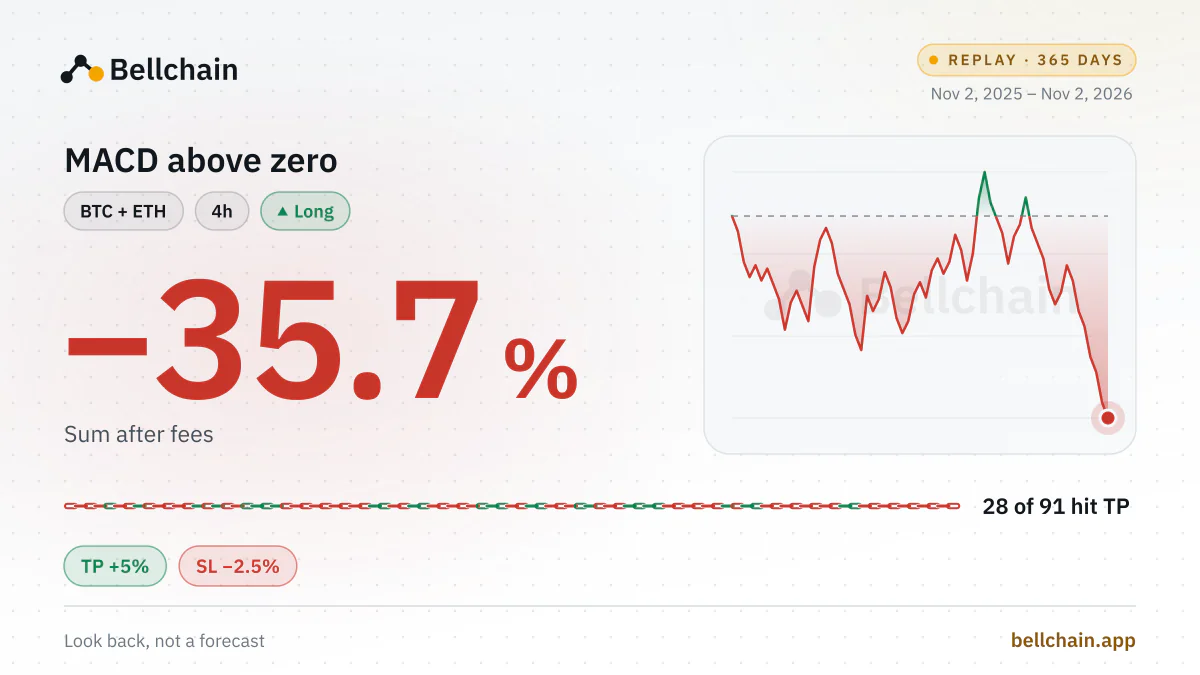
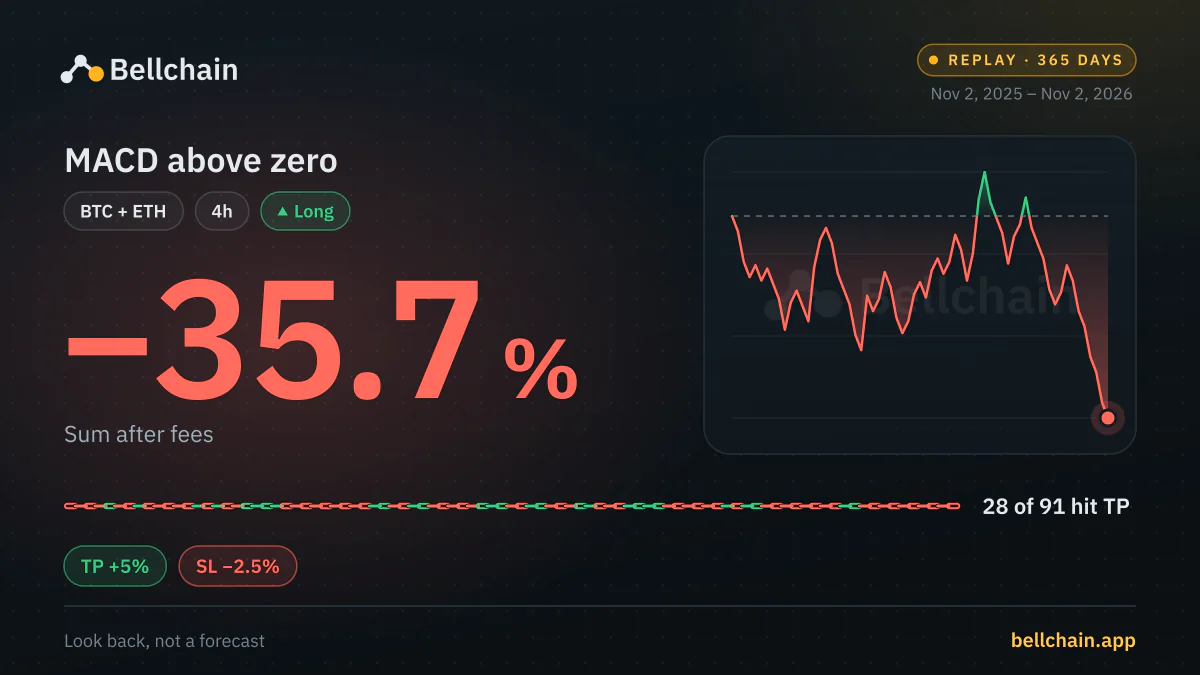
  12. 12 MACD above zero −35.7%
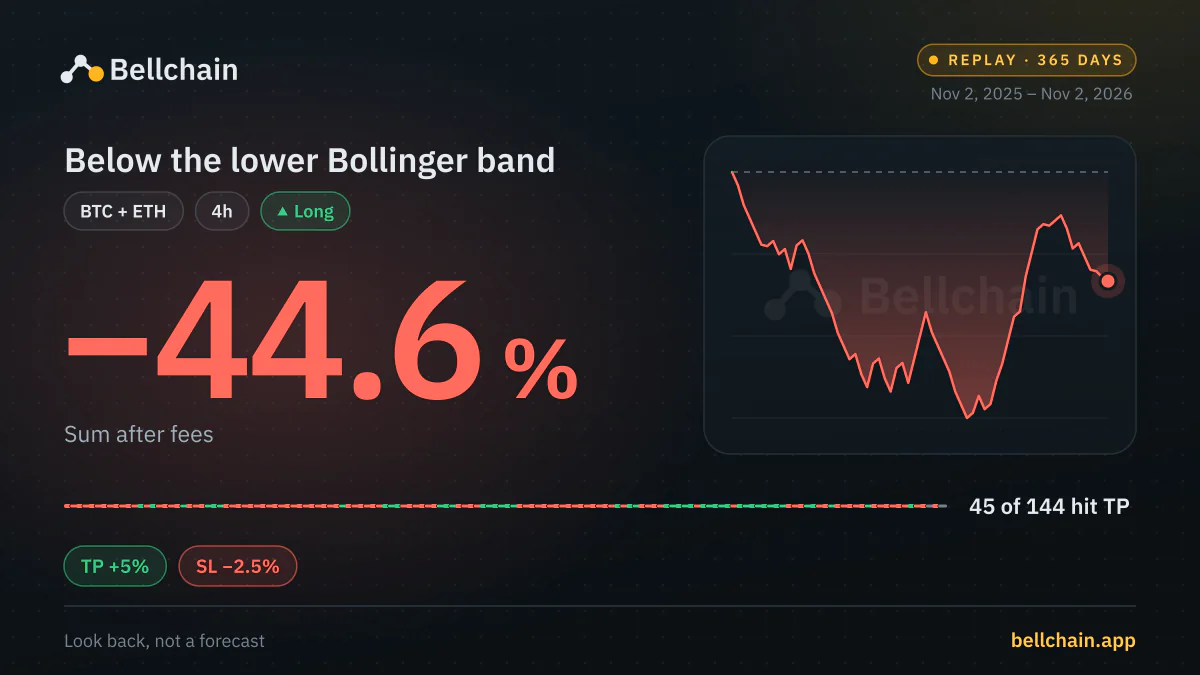
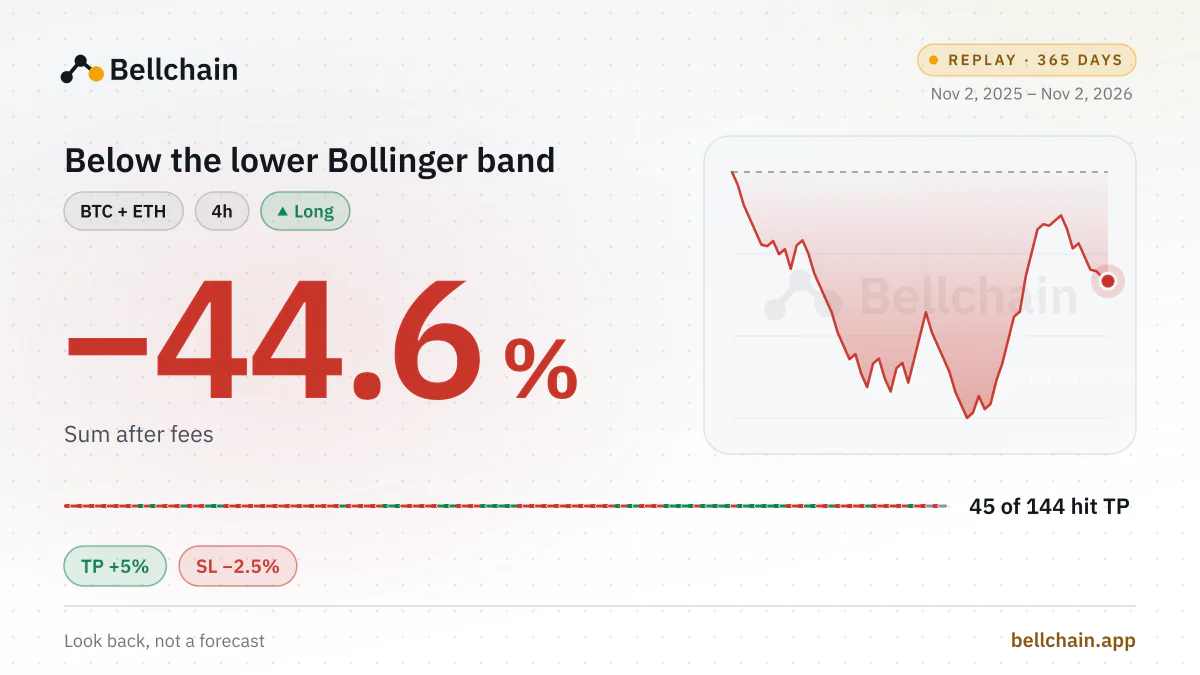
  13. 13 Below the lower Bollinger band −44.6%
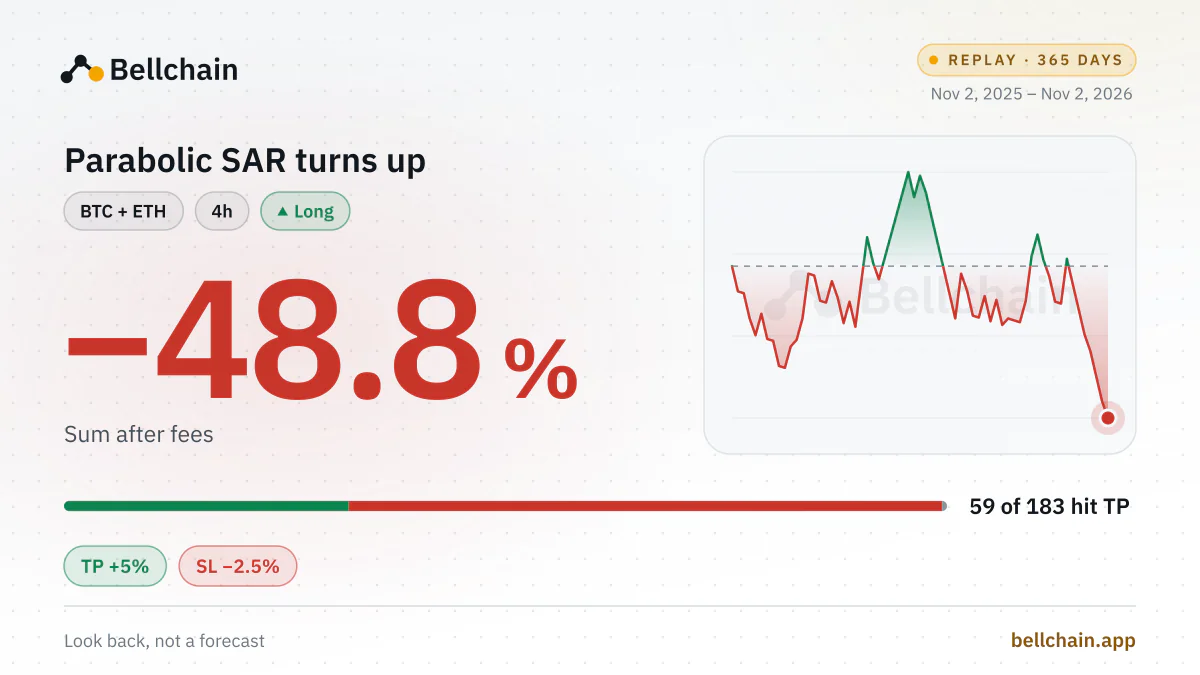
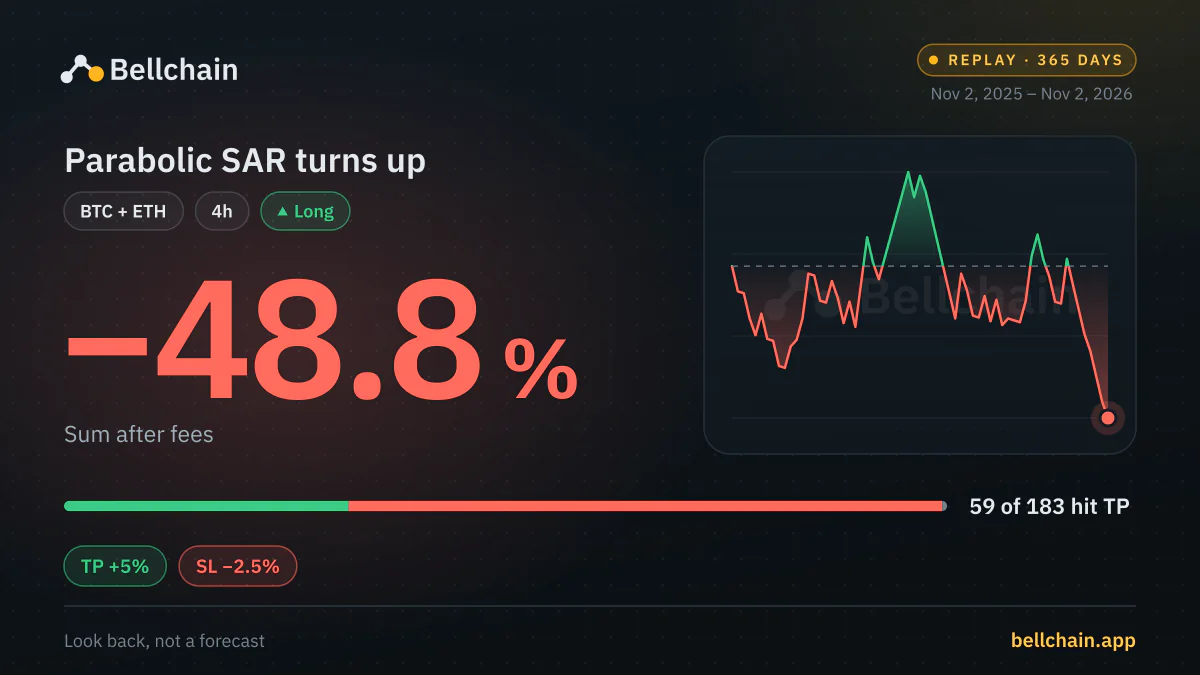
  14. 14 Parabolic SAR turns up −48.8%
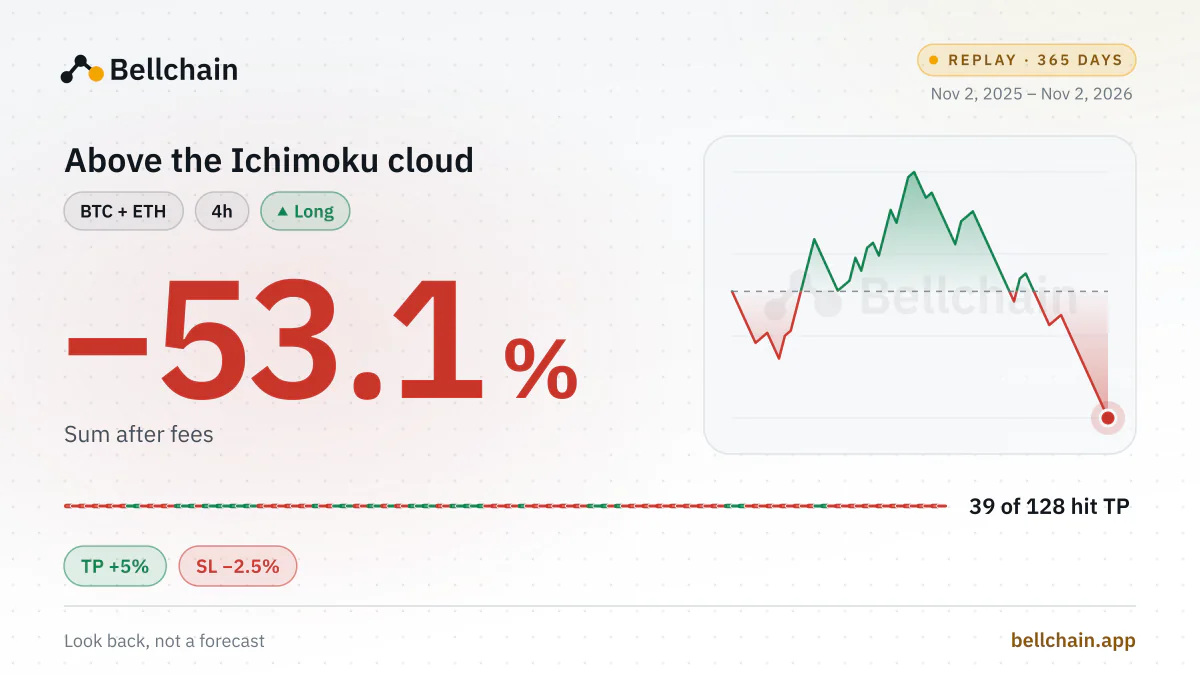
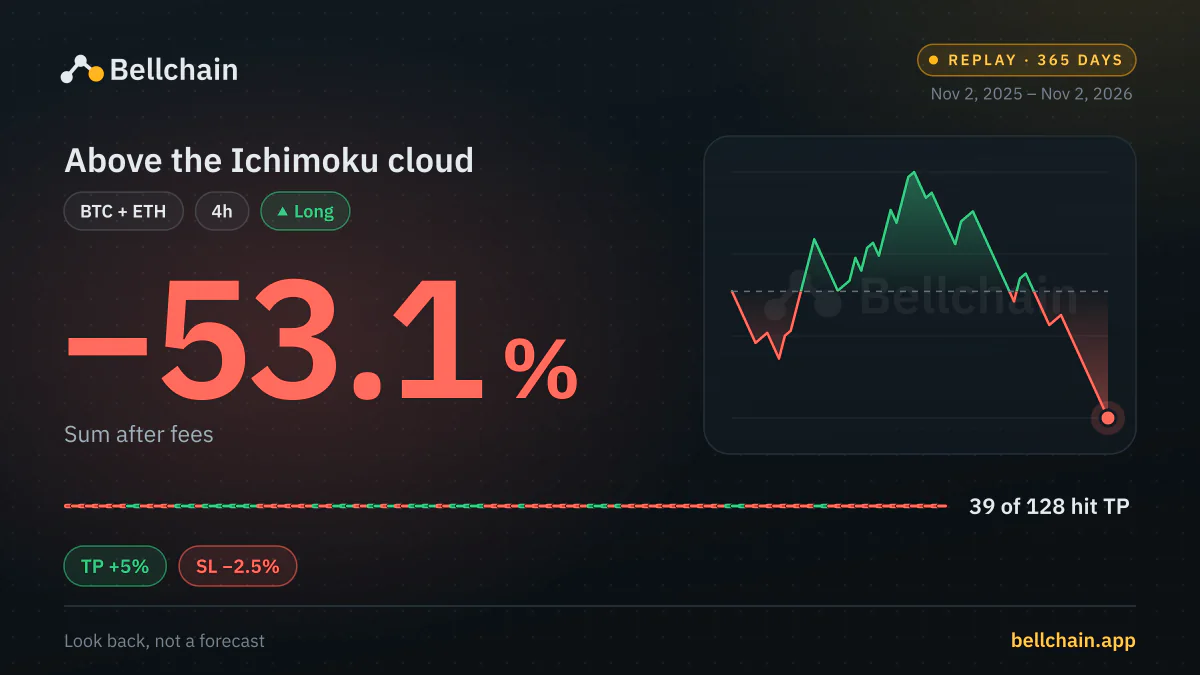
  15. 15 Above the Ichimoku cloud −53.1%
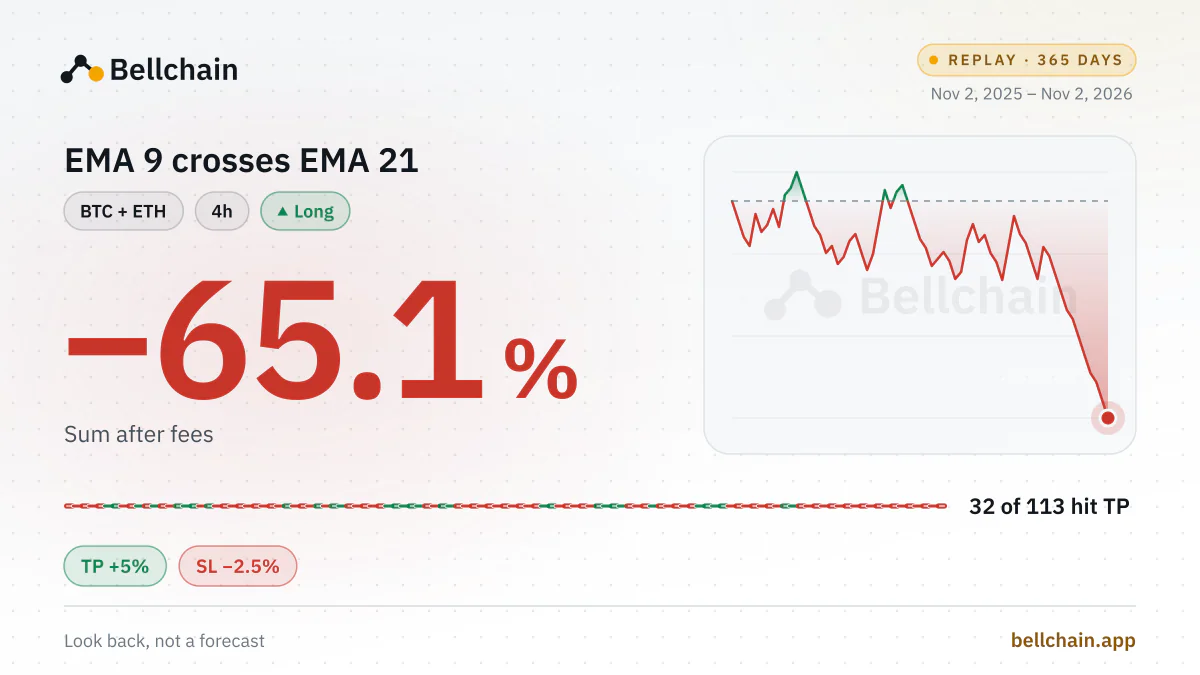
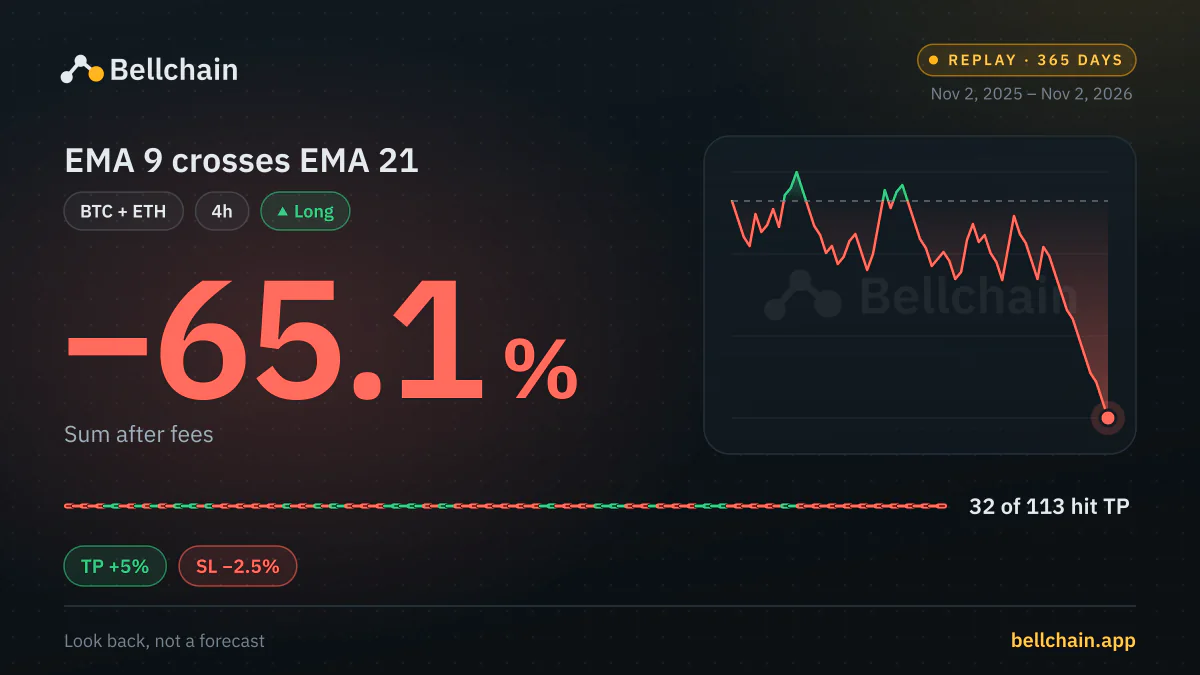
  16. 16 EMA 9 crosses EMA 21 −65.1%
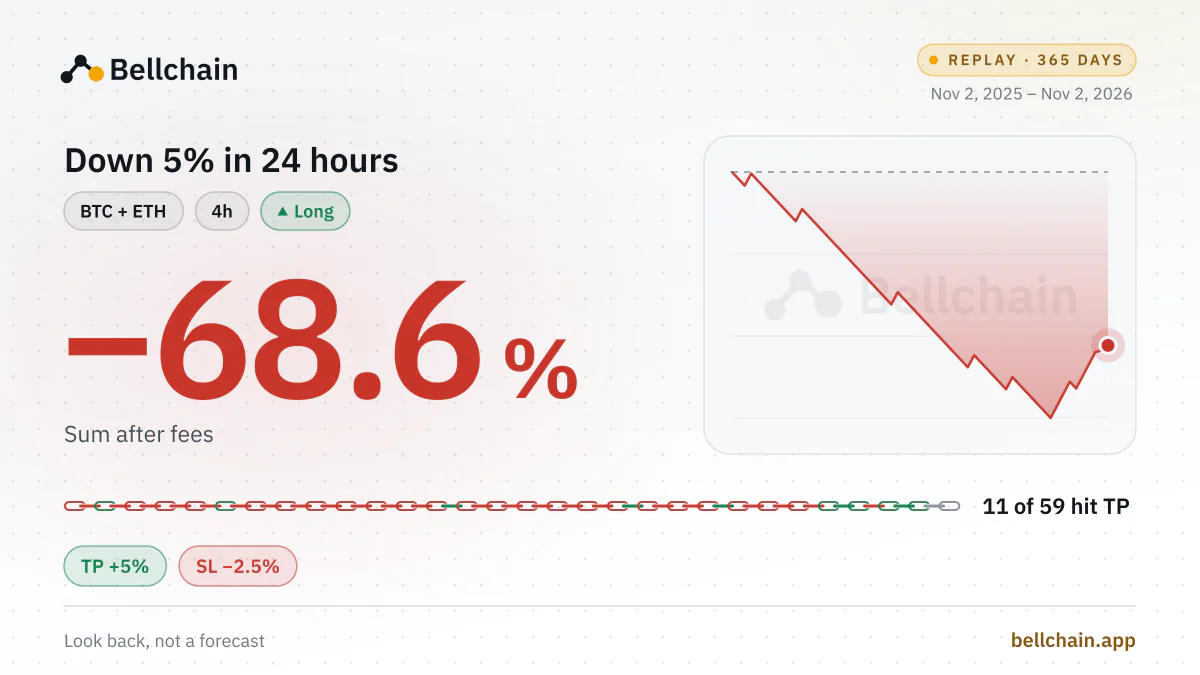
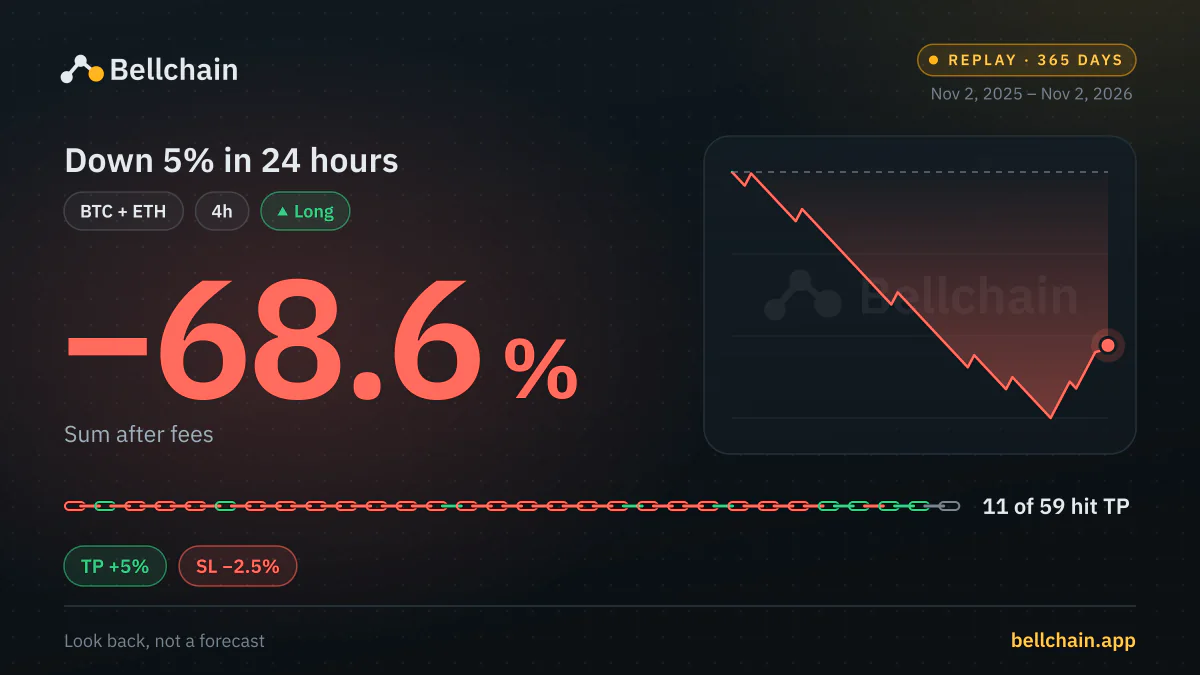
  17. 17 Down 5% in 24 hours −68.6%
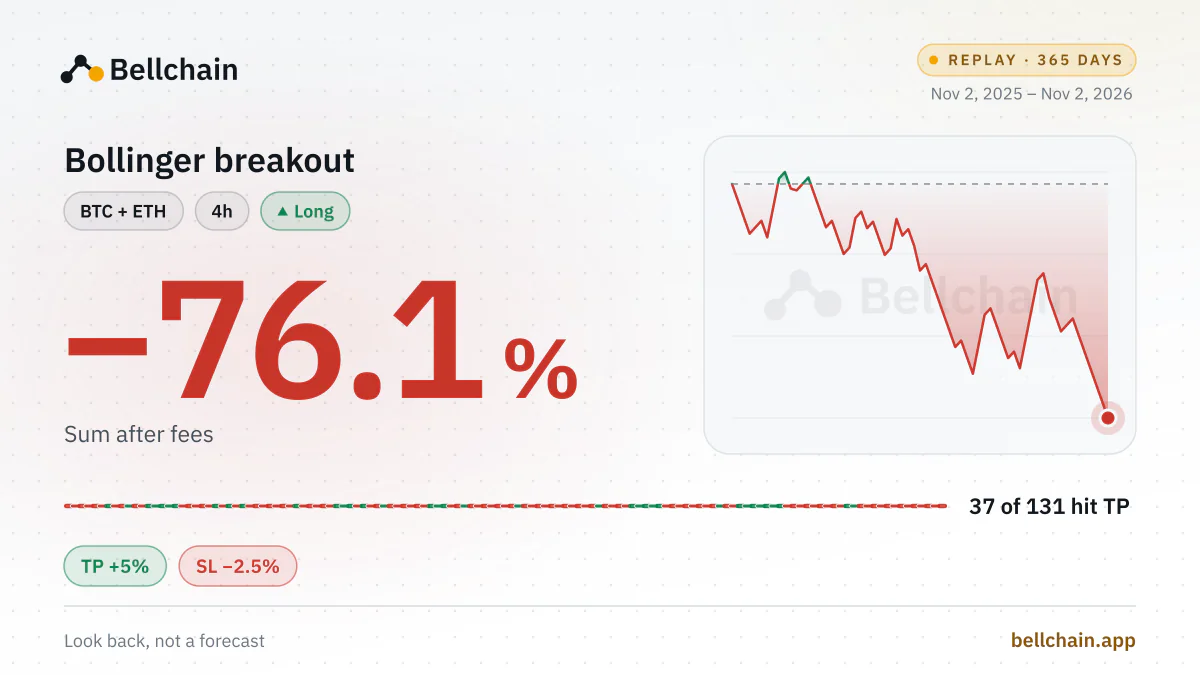
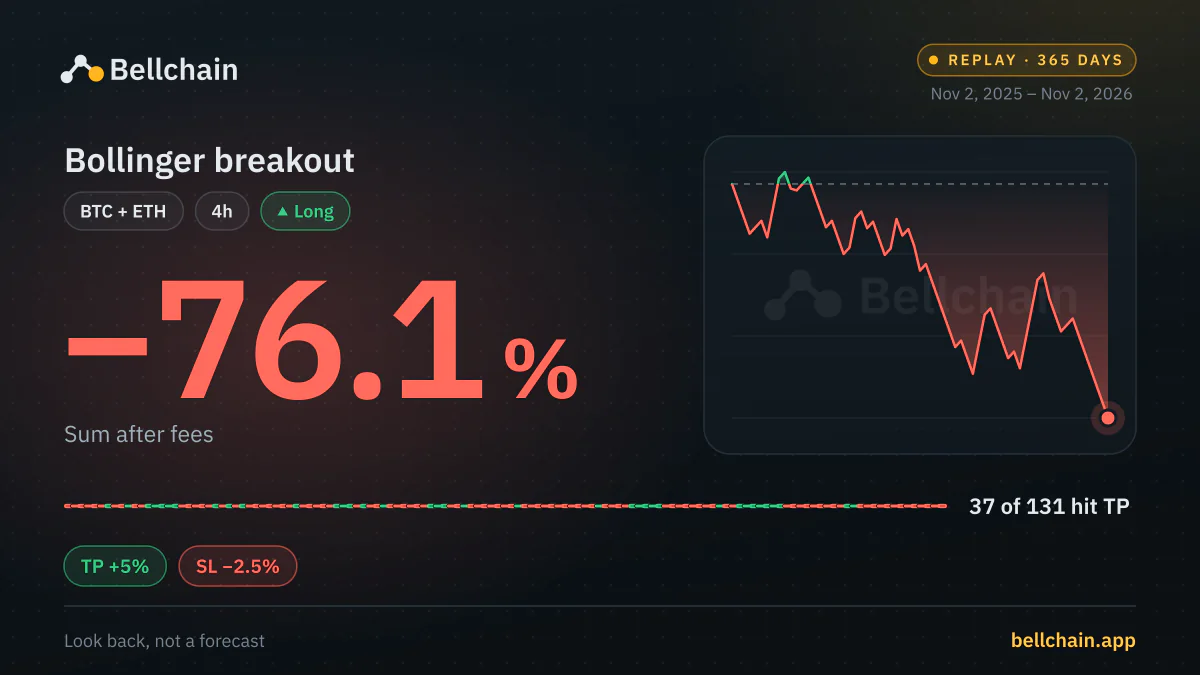
  18. 18 Bollinger breakout −76.1%
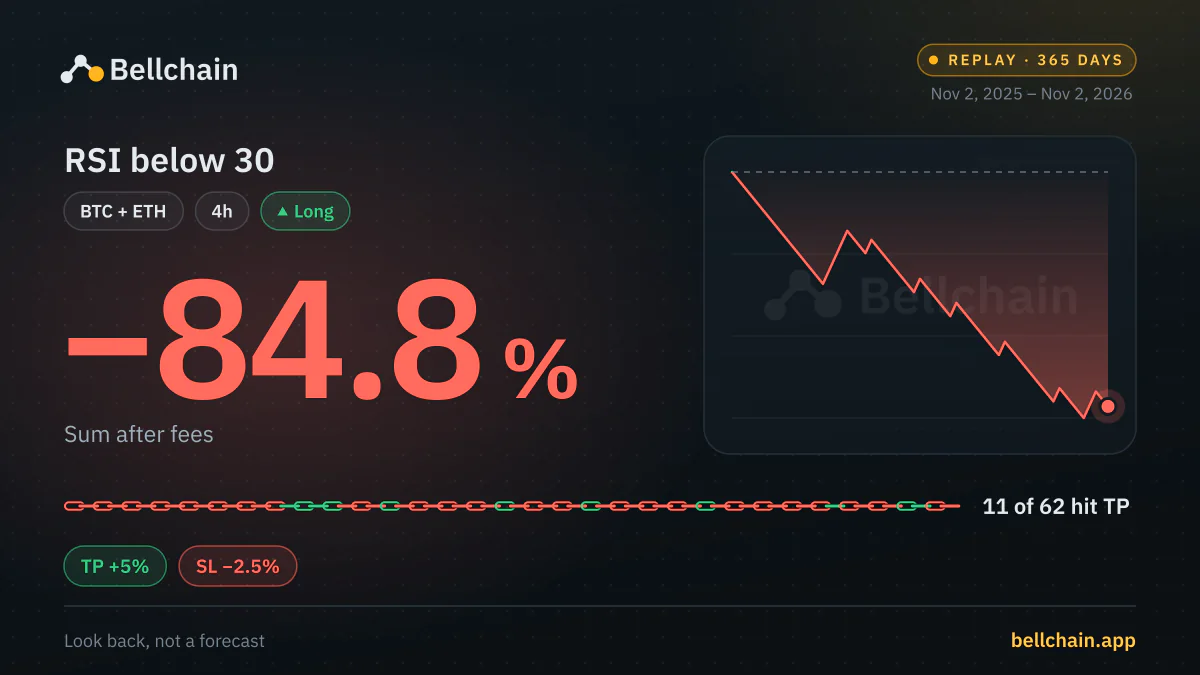
  19. 19 RSI below 30 −84.8%
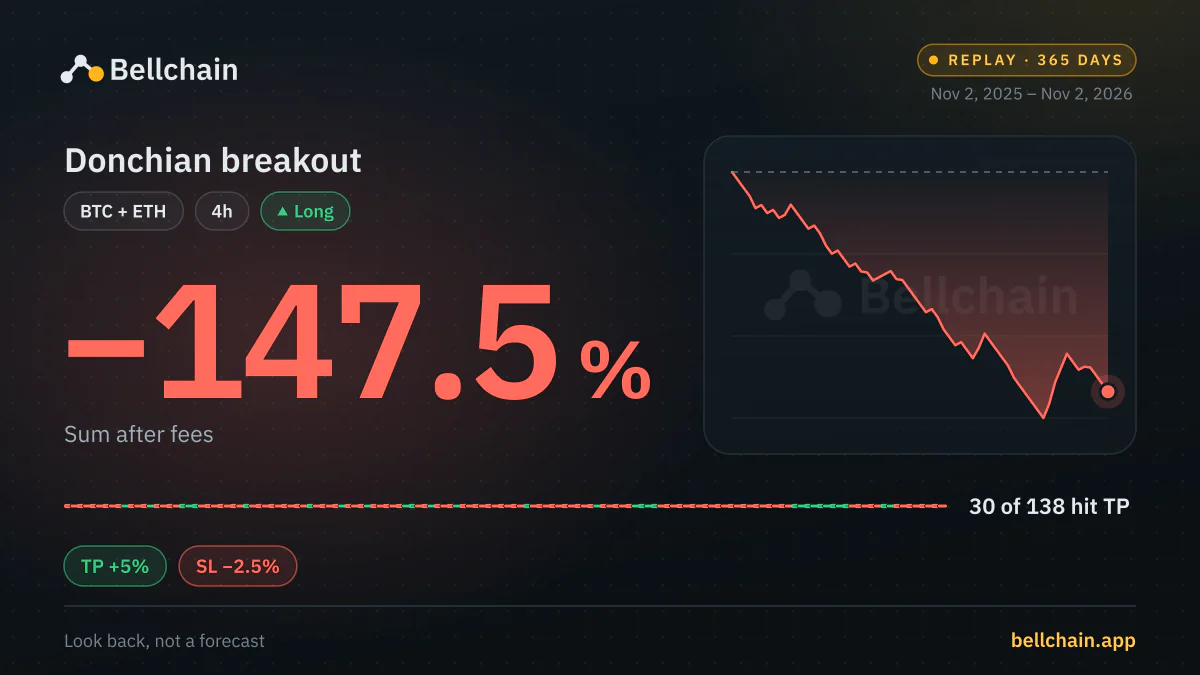
  20. 20 Donchian breakout −147.5%

All rules

Every rule as a card

Bullish engulfing · BTC + ETH 4h · Replay · 365 days · Nov 2, 2025 – Nov 2, 2026 · +36.9% Sum after fees · 46 of 115 hit TP · Look back, not a forecast Bullish engulfing · BTC + ETH 4h · Replay · 365 days · Nov 2, 2025 – Nov 2, 2026 · +36.9% Sum after fees · 46 of 115 hit TP · Look back, not a forecast

Rank 1

Bullish engulfing

A green candle engulfs the red body before it, after a pullback.
  • BTC +2.8% 61 signals · 22 hit TP
  • ETH +34.2% 54 signals · 24 hit TP
Check it yourself
Stochastic turns below 20 · BTC + ETH 4h · Replay · 365 days · Nov 2, 2025 – Nov 2, 2026 · +21.4% Sum after fees · 47 of 124 hit TP · Look back, not a forecast Stochastic turns below 20 · BTC + ETH 4h · Replay · 365 days · Nov 2, 2025 – Nov 2, 2026 · +21.4% Sum after fees · 47 of 124 hit TP · Look back, not a forecast

Rank 2

Stochastic turns below 20

The stochastic %K crosses above %D while below 20.
  • BTC +11.0% 64 signals · 24 hit TP
  • ETH +10.5% 60 signals · 23 hit TP
Check it yourself
Back above the EMA 200 · BTC + ETH 4h · Replay · 365 days · Nov 2, 2025 – Nov 2, 2026 · +8.7% Sum after fees · 26 of 69 hit TP · Look back, not a forecast Back above the EMA 200 · BTC + ETH 4h · Replay · 365 days · Nov 2, 2025 – Nov 2, 2026 · +8.7% Sum after fees · 26 of 69 hit TP · Look back, not a forecast

Rank 3

Back above the EMA 200

The price closes back above the EMA 200.
  • BTC −17.4% 37 signals · 11 hit TP
  • ETH +26.1% 32 signals · 15 hit TP
Check it yourself
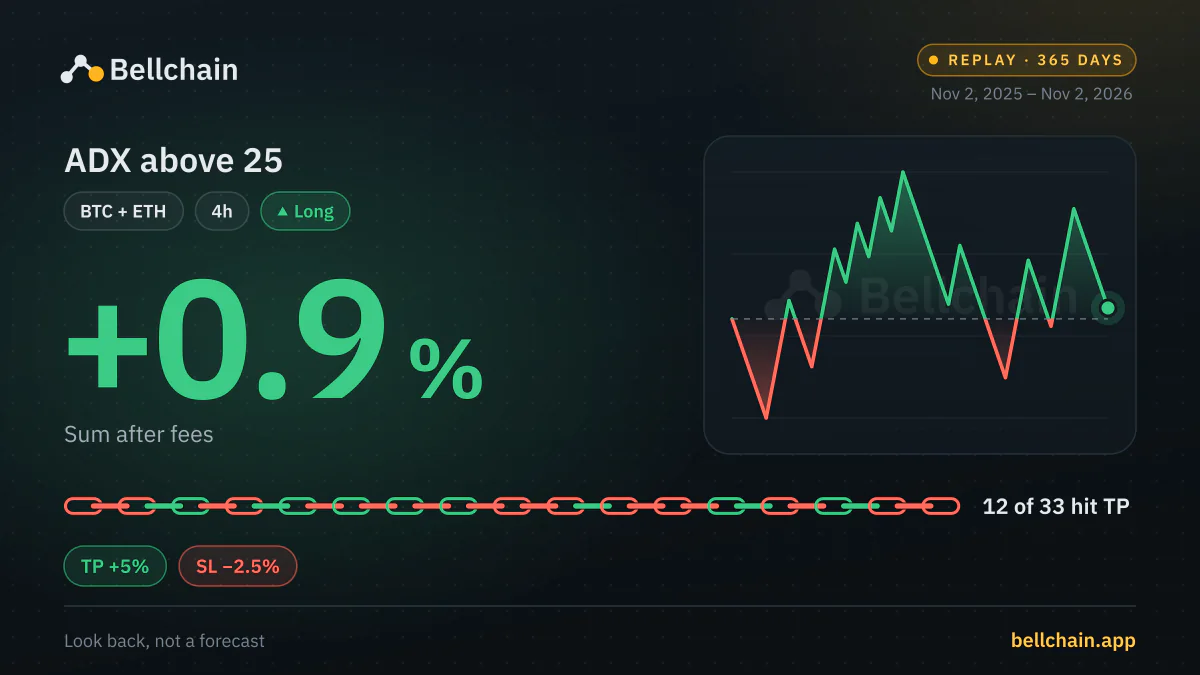
ADX above 25 · BTC + ETH 4h · Replay · 365 days · Nov 2, 2025 – Nov 2, 2026 · +0.9% Sum after fees · 12 of 33 hit TP · Look back, not a forecast ADX above 25 · BTC + ETH 4h · Replay · 365 days · Nov 2, 2025 – Nov 2, 2026 · +0.9% Sum after fees · 12 of 33 hit TP · Look back, not a forecast

Rank 4

ADX above 25

The ADX rises above 25 with +DI above −DI: a strong uptrend begins.
  • BTC +7.2% 14 signals · 6 hit TP
  • ETH −6.3% 19 signals · 6 hit TP
Check it yourself
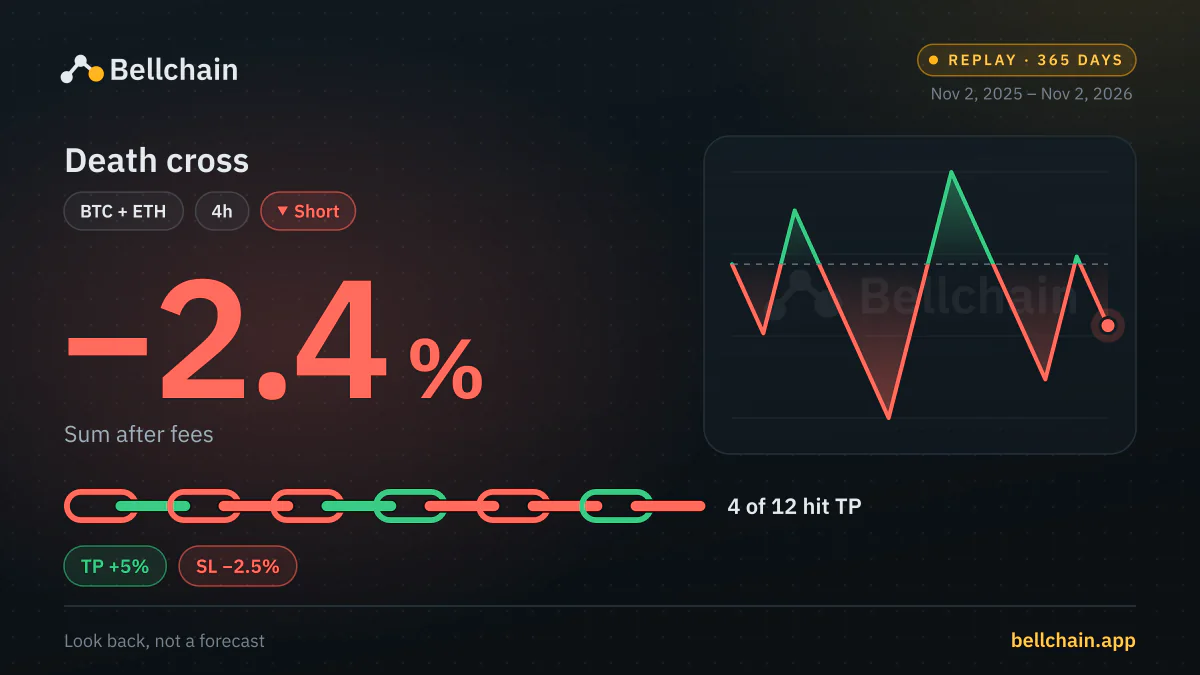
Death cross · BTC + ETH 4h · Replay · 365 days · Nov 2, 2025 – Nov 2, 2026 · −2.4% Sum after fees · 4 of 12 hit TP · Look back, not a forecast Death cross · BTC + ETH 4h · Replay · 365 days · Nov 2, 2025 – Nov 2, 2026 · −2.4% Sum after fees · 4 of 12 hit TP · Look back, not a forecast

Rank 5

Death cross

The SMA 50 crosses below the SMA 200.
  • BTC −8.7% 6 signals · 1 hit TP
  • ETH +6.3% 6 signals · 3 hit TP
Check it yourself
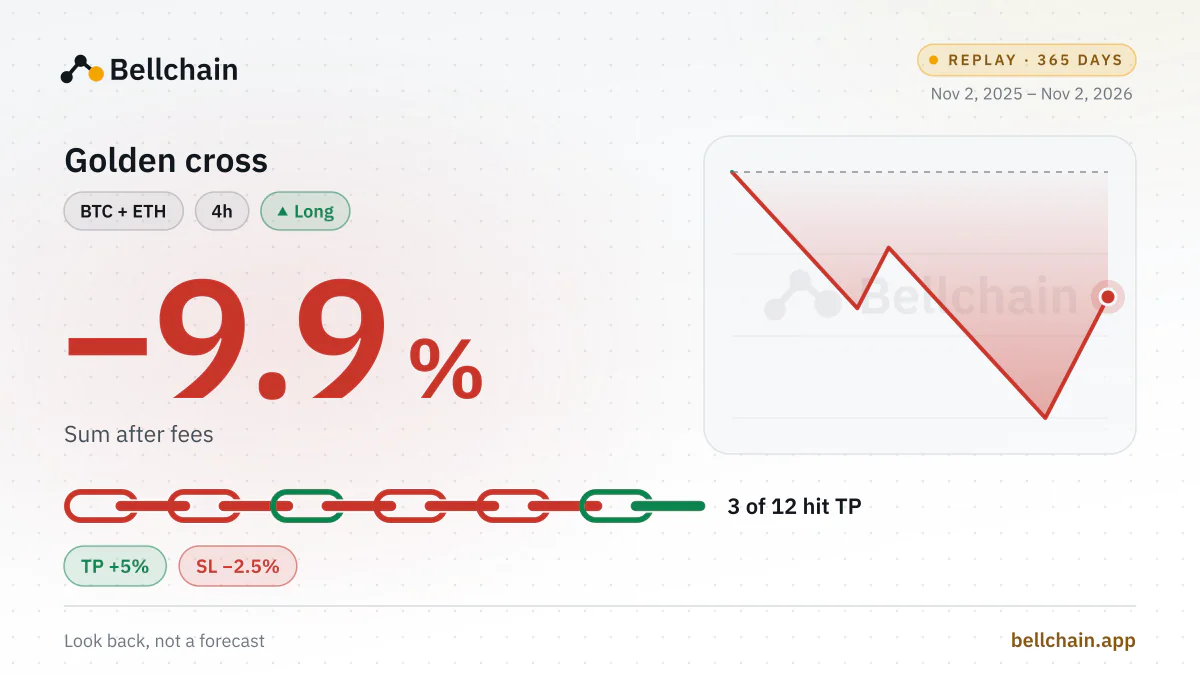
Golden cross · BTC + ETH 4h · Replay · 365 days · Nov 2, 2025 – Nov 2, 2026 · −9.9% Sum after fees · 3 of 12 hit TP · Look back, not a forecast Golden cross · BTC + ETH 4h · Replay · 365 days · Nov 2, 2025 – Nov 2, 2026 · −9.9% Sum after fees · 3 of 12 hit TP · Look back, not a forecast

Rank 6

Golden cross

The SMA 50 crosses above the SMA 200.
  • BTC −8.7% 6 signals · 1 hit TP
  • ETH −1.2% 6 signals · 2 hit TP
Check it yourself
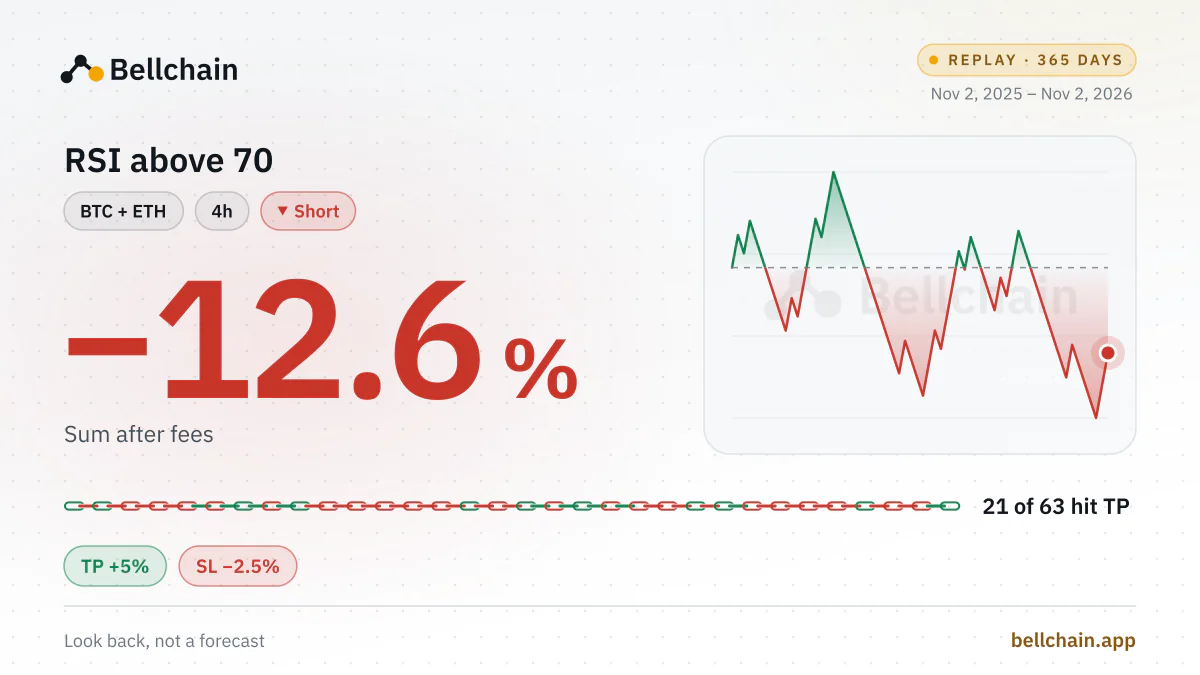
RSI above 70 · BTC + ETH 4h · Replay · 365 days · Nov 2, 2025 – Nov 2, 2026 · −12.6% Sum after fees · 21 of 63 hit TP · Look back, not a forecast RSI above 70 · BTC + ETH 4h · Replay · 365 days · Nov 2, 2025 – Nov 2, 2026 · −12.6% Sum after fees · 21 of 63 hit TP · Look back, not a forecast

Rank 7

RSI above 70

The RSI 14 rises above 70: overbought, going short for the pullback.
  • BTC −16.2% 31 signals · 9 hit TP
  • ETH +3.6% 32 signals · 12 hit TP
Check it yourself
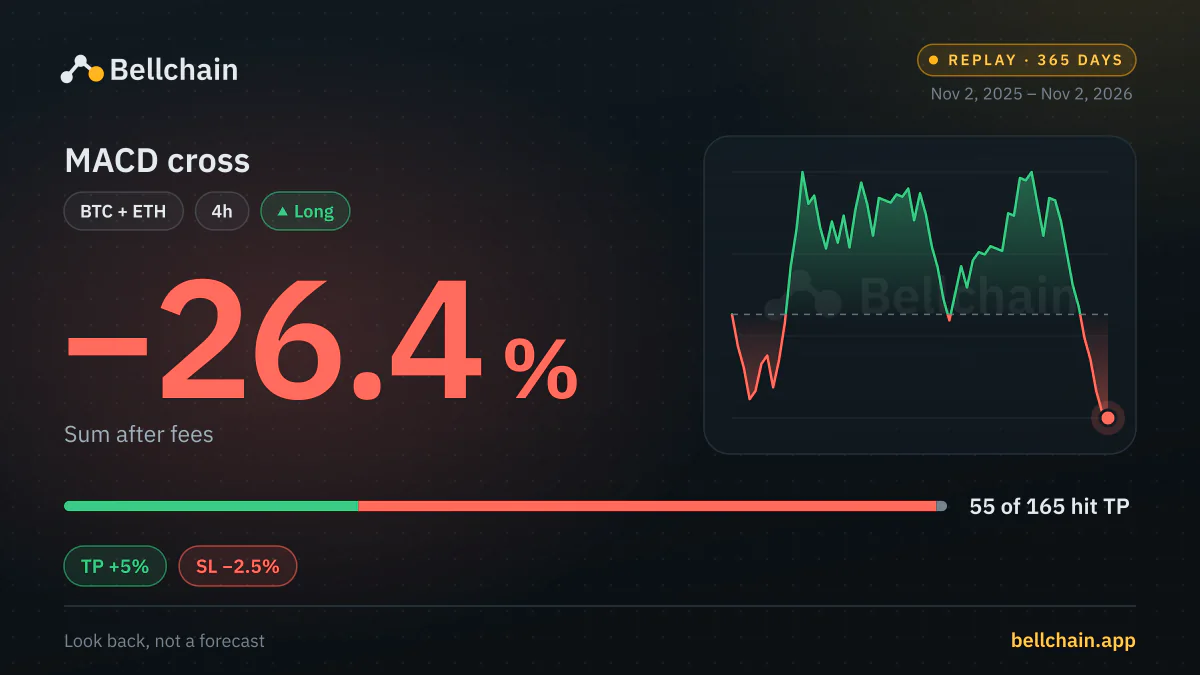
MACD cross · BTC + ETH 4h · Replay · 365 days · Nov 2, 2025 – Nov 2, 2026 · −26.4% Sum after fees · 55 of 165 hit TP · Look back, not a forecast MACD cross · BTC + ETH 4h · Replay · 365 days · Nov 2, 2025 – Nov 2, 2026 · −26.4% Sum after fees · 55 of 165 hit TP · Look back, not a forecast

Rank 8

MACD cross

The MACD crosses above its signal line.
  • BTC −15.1% 79 signals · 26 hit TP
  • ETH −11.3% 86 signals · 29 hit TP
Check it yourself
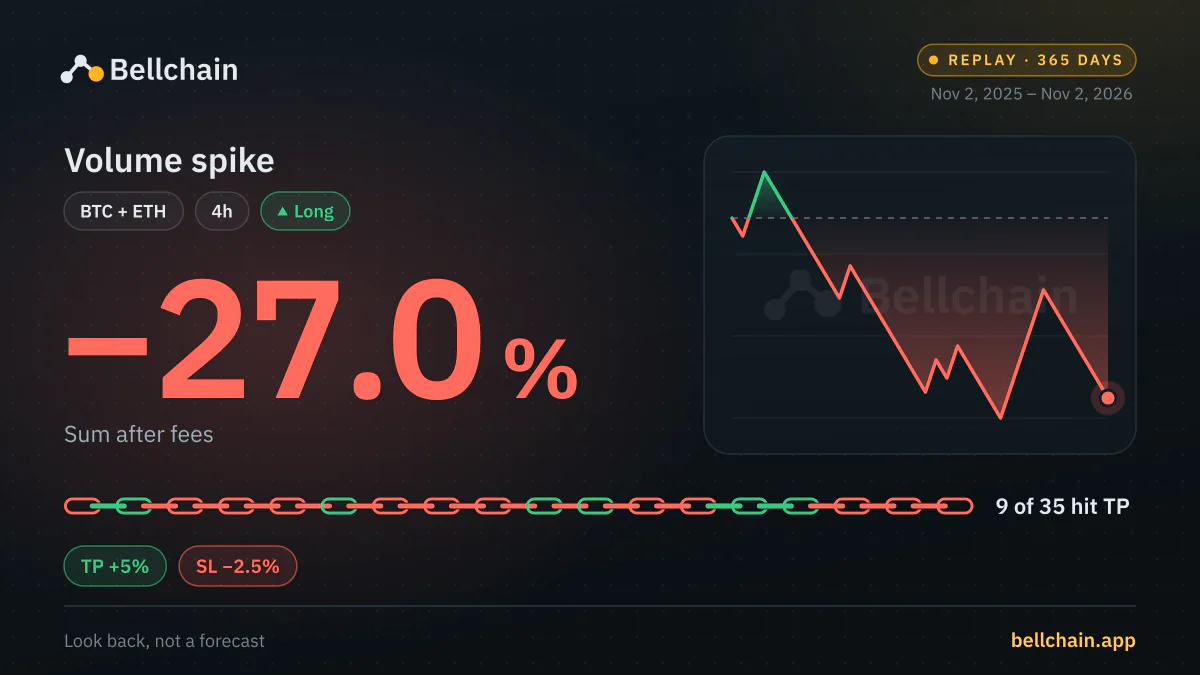
Volume spike · BTC + ETH 4h · Replay · 365 days · Nov 2, 2025 – Nov 2, 2026 · −27.0% Sum after fees · 9 of 35 hit TP · Look back, not a forecast Volume spike · BTC + ETH 4h · Replay · 365 days · Nov 2, 2025 – Nov 2, 2026 · −27.0% Sum after fees · 9 of 35 hit TP · Look back, not a forecast

Rank 9

Volume spike

Three times the average volume of the last 20 candles, with the price rising.
  • BTC −8.4% 17 signals · 5 hit TP
  • ETH −18.6% 18 signals · 4 hit TP
Check it yourself
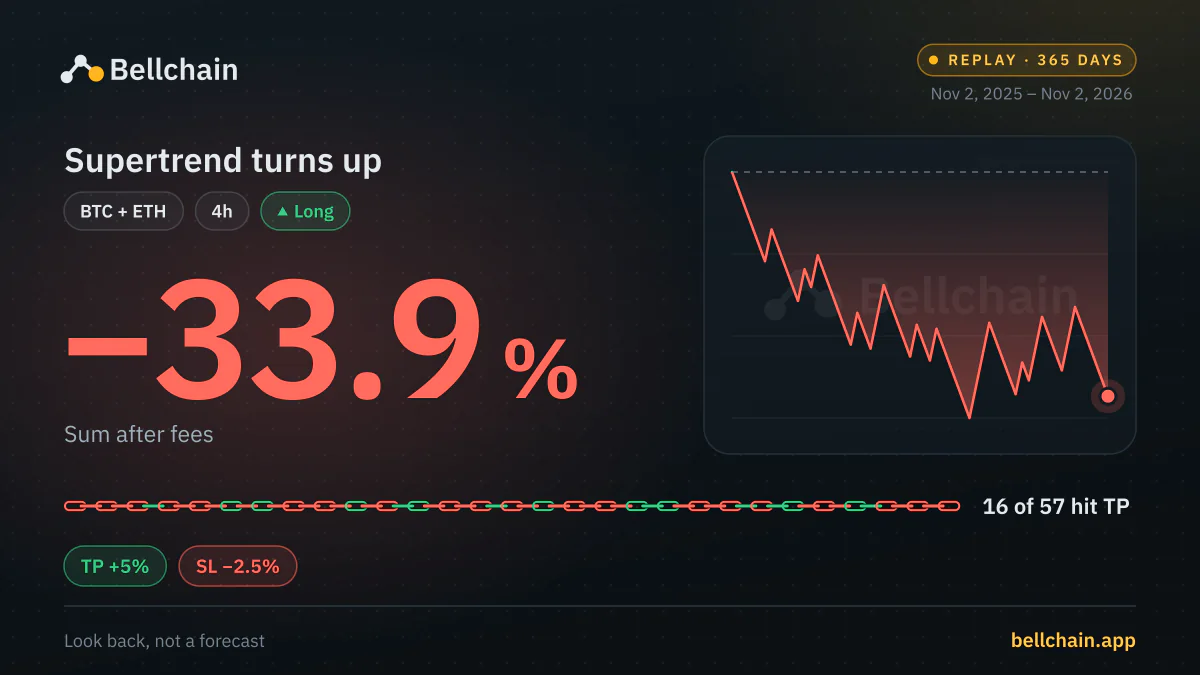
Supertrend turns up · BTC + ETH 4h · Replay · 365 days · Nov 2, 2025 – Nov 2, 2026 · −33.9% Sum after fees · 16 of 57 hit TP · Look back, not a forecast Supertrend turns up · BTC + ETH 4h · Replay · 365 days · Nov 2, 2025 – Nov 2, 2026 · −33.9% Sum after fees · 16 of 57 hit TP · Look back, not a forecast

Rank 10

Supertrend turns up

The Supertrend (10, 3) flips to an uptrend.
  • BTC −18.3% 29 signals · 8 hit TP
  • ETH −15.6% 28 signals · 8 hit TP
Check it yourself
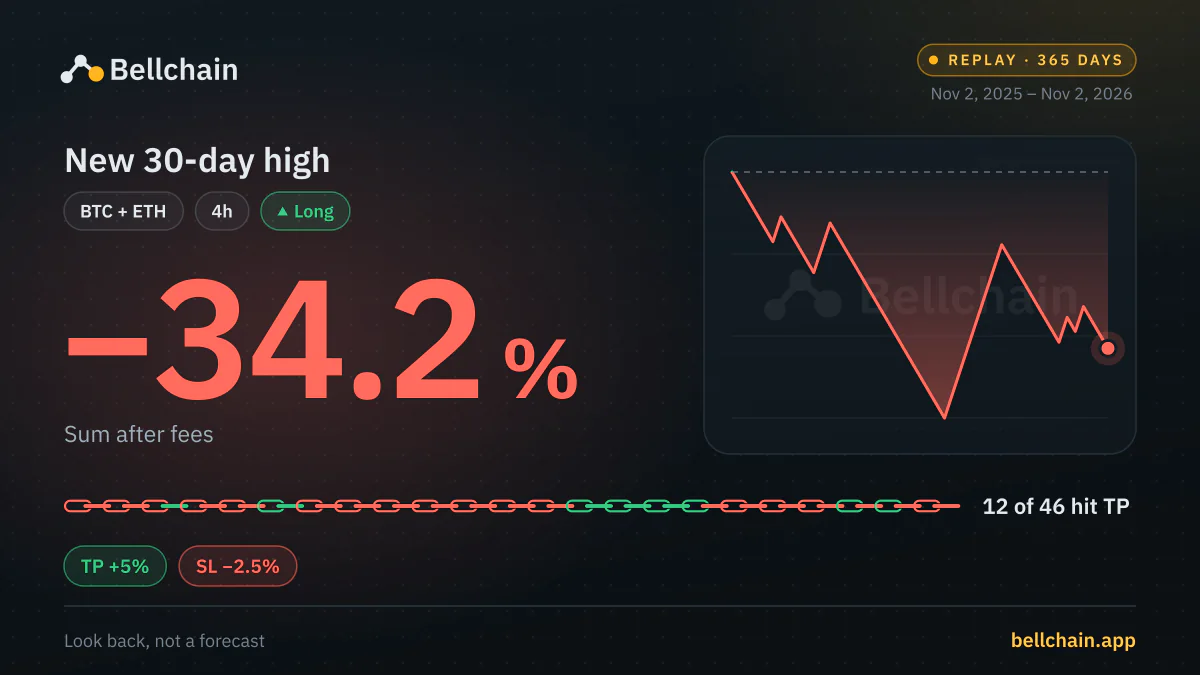
New 30-day high · BTC + ETH 4h · Replay · 365 days · Nov 2, 2025 – Nov 2, 2026 · −34.2% Sum after fees · 12 of 46 hit TP · Look back, not a forecast New 30-day high · BTC + ETH 4h · Replay · 365 days · Nov 2, 2025 – Nov 2, 2026 · −34.2% Sum after fees · 12 of 46 hit TP · Look back, not a forecast

Rank 11

New 30-day high

The price closes at its highest level of the last 30 days.
  • BTC −24.6% 23 signals · 5 hit TP
  • ETH −9.6% 23 signals · 7 hit TP
Check it yourself
MACD above zero · BTC + ETH 4h · Replay · 365 days · Nov 2, 2025 – Nov 2, 2026 · −35.7% Sum after fees · 28 of 91 hit TP · Look back, not a forecast MACD above zero · BTC + ETH 4h · Replay · 365 days · Nov 2, 2025 – Nov 2, 2026 · −35.7% Sum after fees · 28 of 91 hit TP · Look back, not a forecast

Rank 12

MACD above zero

The MACD rises above the zero line.

  • BTC −12.9% 52 signals · 17 hit TP
  • ETH −22.8% 39 signals · 11 hit TP
Check it yourself
Below the lower Bollinger band · BTC + ETH 4h · Replay · 365 days · Nov 2, 2025 – Nov 2, 2026 · −44.6% Sum after fees · 45 of 144 hit TP · Look back, not a forecast Below the lower Bollinger band · BTC + ETH 4h · Replay · 365 days · Nov 2, 2025 – Nov 2, 2026 · −44.6% Sum after fees · 45 of 144 hit TP · Look back, not a forecast

Rank 13

Below the lower Bollinger band

The price closes below the lower Bollinger band: going long for the return into the band.
  • BTC −25.4% 73 signals · 22 hit TP
  • ETH −19.2% 71 signals · 23 hit TP
Check it yourself
Parabolic SAR turns up · BTC + ETH 4h · Replay · 365 days · Nov 2, 2025 – Nov 2, 2026 · −48.8% Sum after fees · 59 of 183 hit TP · Look back, not a forecast Parabolic SAR turns up · BTC + ETH 4h · Replay · 365 days · Nov 2, 2025 – Nov 2, 2026 · −48.8% Sum after fees · 59 of 183 hit TP · Look back, not a forecast

Rank 14

Parabolic SAR turns up

The Parabolic SAR flips below the price.
  • BTC −51.3% 94 signals · 27 hit TP
  • ETH +2.5% 89 signals · 32 hit TP
Check it yourself
Above the Ichimoku cloud · BTC + ETH 4h · Replay · 365 days · Nov 2, 2025 – Nov 2, 2026 · −53.1% Sum after fees · 39 of 128 hit TP · Look back, not a forecast Above the Ichimoku cloud · BTC + ETH 4h · Replay · 365 days · Nov 2, 2025 – Nov 2, 2026 · −53.1% Sum after fees · 39 of 128 hit TP · Look back, not a forecast

Rank 15

Above the Ichimoku cloud

The price closes above the Ichimoku cloud.
  • BTC +7.2% 64 signals · 24 hit TP
  • ETH −60.2% 64 signals · 15 hit TP
Check it yourself
EMA 9 crosses EMA 21 · BTC + ETH 4h · Replay · 365 days · Nov 2, 2025 – Nov 2, 2026 · −65.1% Sum after fees · 32 of 113 hit TP · Look back, not a forecast EMA 9 crosses EMA 21 · BTC + ETH 4h · Replay · 365 days · Nov 2, 2025 – Nov 2, 2026 · −65.1% Sum after fees · 32 of 113 hit TP · Look back, not a forecast

Rank 16

EMA 9 crosses EMA 21

The fast EMA 9 crosses above the EMA 21.
  • BTC −21.0% 55 signals · 17 hit TP
  • ETH −44.1% 58 signals · 15 hit TP
Check it yourself
Down 5% in 24 hours · BTC + ETH 4h · Replay · 365 days · Nov 2, 2025 – Nov 2, 2026 · −68.6% Sum after fees · 11 of 59 hit TP · Look back, not a forecast Down 5% in 24 hours · BTC + ETH 4h · Replay · 365 days · Nov 2, 2025 – Nov 2, 2026 · −68.6% Sum after fees · 11 of 59 hit TP · Look back, not a forecast

Rank 17

Down 5% in 24 hours

The price falls more than 5% in 24 hours: going long after the drop.
  • BTC −12.4% 17 signals · 4 hit TP
  • ETH −56.2% 42 signals · 7 hit TP
Check it yourself
Bollinger breakout · BTC + ETH 4h · Replay · 365 days · Nov 2, 2025 – Nov 2, 2026 · −76.1% Sum after fees · 37 of 131 hit TP · Look back, not a forecast Bollinger breakout · BTC + ETH 4h · Replay · 365 days · Nov 2, 2025 – Nov 2, 2026 · −76.1% Sum after fees · 37 of 131 hit TP · Look back, not a forecast

Rank 18

Bollinger breakout

The price closes above the upper Bollinger band (20, 2).
  • BTC −30.9% 67 signals · 20 hit TP
  • ETH −45.3% 64 signals · 17 hit TP
Check it yourself
RSI below 30 · BTC + ETH 4h · Replay · 365 days · Nov 2, 2025 – Nov 2, 2026 · −84.8% Sum after fees · 11 of 62 hit TP · Look back, not a forecast RSI below 30 · BTC + ETH 4h · Replay · 365 days · Nov 2, 2025 – Nov 2, 2026 · −84.8% Sum after fees · 11 of 62 hit TP · Look back, not a forecast

Rank 19

RSI below 30

The RSI 14 drops below 30: oversold, going long for the bounce.
  • BTC −48.3% 29 signals · 4 hit TP
  • ETH −36.6% 33 signals · 7 hit TP
Check it yourself
Donchian breakout · BTC + ETH 4h · Replay · 365 days · Nov 2, 2025 – Nov 2, 2026 · −147.5% Sum after fees · 30 of 138 hit TP · Look back, not a forecast Donchian breakout · BTC + ETH 4h · Replay · 365 days · Nov 2, 2025 – Nov 2, 2026 · −147.5% Sum after fees · 30 of 138 hit TP · Look back, not a forecast

Rank 20

Donchian breakout

The price closes above the high of the last 20 candles, like the Turtle traders.

  • BTC −81.8% 72 signals · 15 hit TP
  • ETH −65.6% 66 signals · 15 hit TP
Check it yourself

Method

How we computed it

  • Prices: 4-hour candles of BTC/USDT and ETH/USDT from a large exchange, 2 November 2025 to 2 November 2026, plus enough candles before so that every indicator has settled.
  • Rules: one chain per rule with the default values of the indicators, nothing tuned. A signal comes when the condition switches from false to true, at most every 4 hours, as in live operation.
  • Trades: entry at the close of the signal candle, exit at TP +5% or SL −2.5%, whichever comes first; if one candle reaches both, the SL counts. Whatever is still open at the end counts at its last price.
  • Fees: 0.1% per side. The sum adds up every signal with the same stake, without compounding.

Check your own rule

Build your rule from blocks and see in the replay right away how it would have turned out with TP and SL, after fees and without an account.